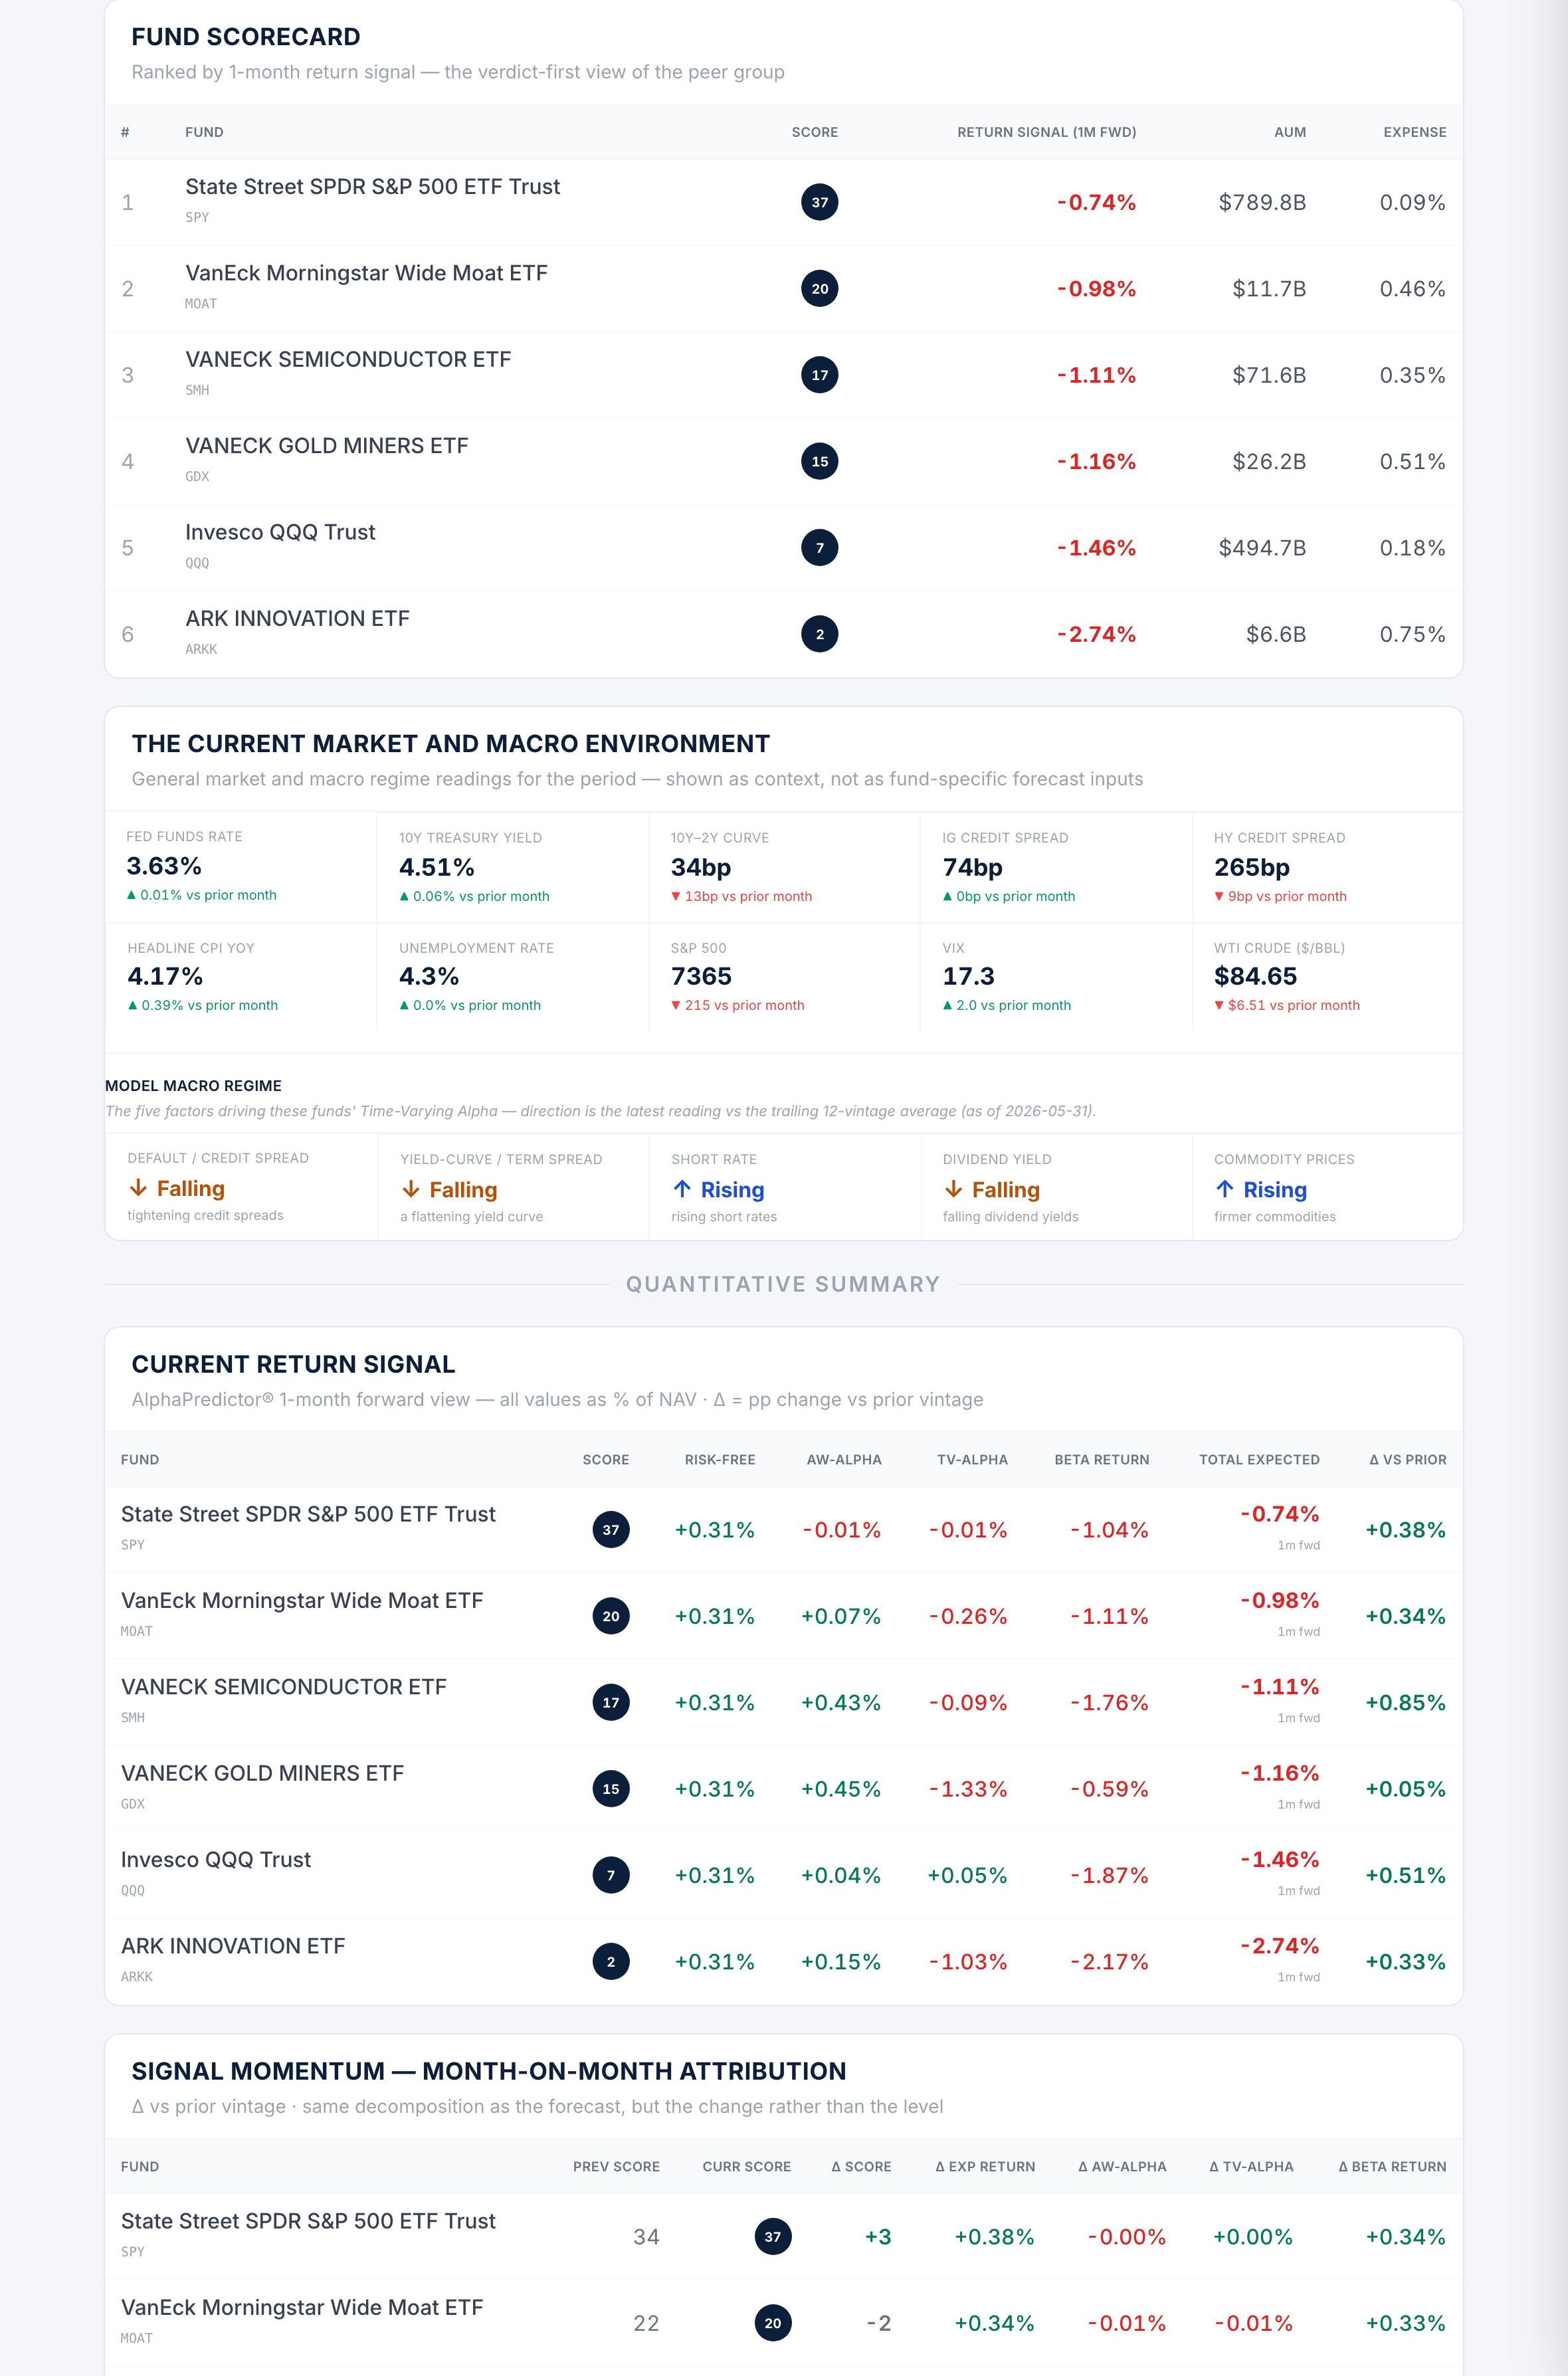
Institutional fund intelligence

The forward-looking return signal for every US equity ETF — and where it comes from.

A Bayesian research model produces a forward-looking return signal for 1,221 US equity ETFs — conditioned on the macro environment, updated as the model learns each month, and showing exactly how every estimate is built. Validated walk-forward since 2009.

See the validation →

Tested out of sample since 2009 · up to 72% directional hit rate · top-quintile spread positive at every horizon

Exhibit 1 — Forecast validation Walk-forward · 2009–2026
Top quintile (model-ranked) +14.41% p.a.
Bottom quintile +5.37% p.a.
+9.04%
p.a. top–bottom spread
1-month horizon · 198 periods
non-overlapping · out of sample
Directional hit rate, by horizon
59%
1-month
66%
3-month
72%
6-month
62%
12-month

See it in action

A two-minute tour of every tab

From the screener and validation to portfolios, the optimizer and fund-level transparency — watch how the whole platform fits together.

The proof — and how it's built

How the validation is built

The figures above aren't a back-test we curated — they're computed live in the platform. Every month since December 2009 the model ranks the full universe by its return signal, sorts it into five groups, and tracks what the top and bottom groups actually did next, with no look-ahead.

Out of sample

Every estimate is scored before the month it forecasts — no look-ahead, evaluated walk-forward on non-overlapping periods.

The full universe

All 1,221 equity ETFs are ranked every month — not a curated subset and not the survivors that happened to do well.

The live signal

It's the exact signal used in production scoring — recomputed in the platform, the same numbers you see in the hero exhibit.

Headline figures are shown at the 1-month horizon across the full equity-ETF universe, 198 monthly periods since December 2009. These are hypothetical research statistics — not returns achieved by any investor — shown gross of fees, costs and taxes. Past model performance does not guarantee future results. Full disclaimer.

The difference

Most screeners rank funds on what already happened. AlphaPredictor® models what may come next — and shows its work.

Forward-looking

A forward-looking return signal for the month ahead — not a ranking of the past three years. Every figure decomposes into alpha, factor return and the risk-free rate.

Macro-aware

Alpha is conditioned on the macro cycle — credit spreads, rates, the yield curve, commodities — so forecasts shift when the regime does, not a year later.

Self-correcting

A Bayesian engine updates its belief about every fund as each month's data arrives — and has 16 years of live, out-of-sample results to show for it.

Explore the platform ↓

The macro engine

Alpha depends on the regime

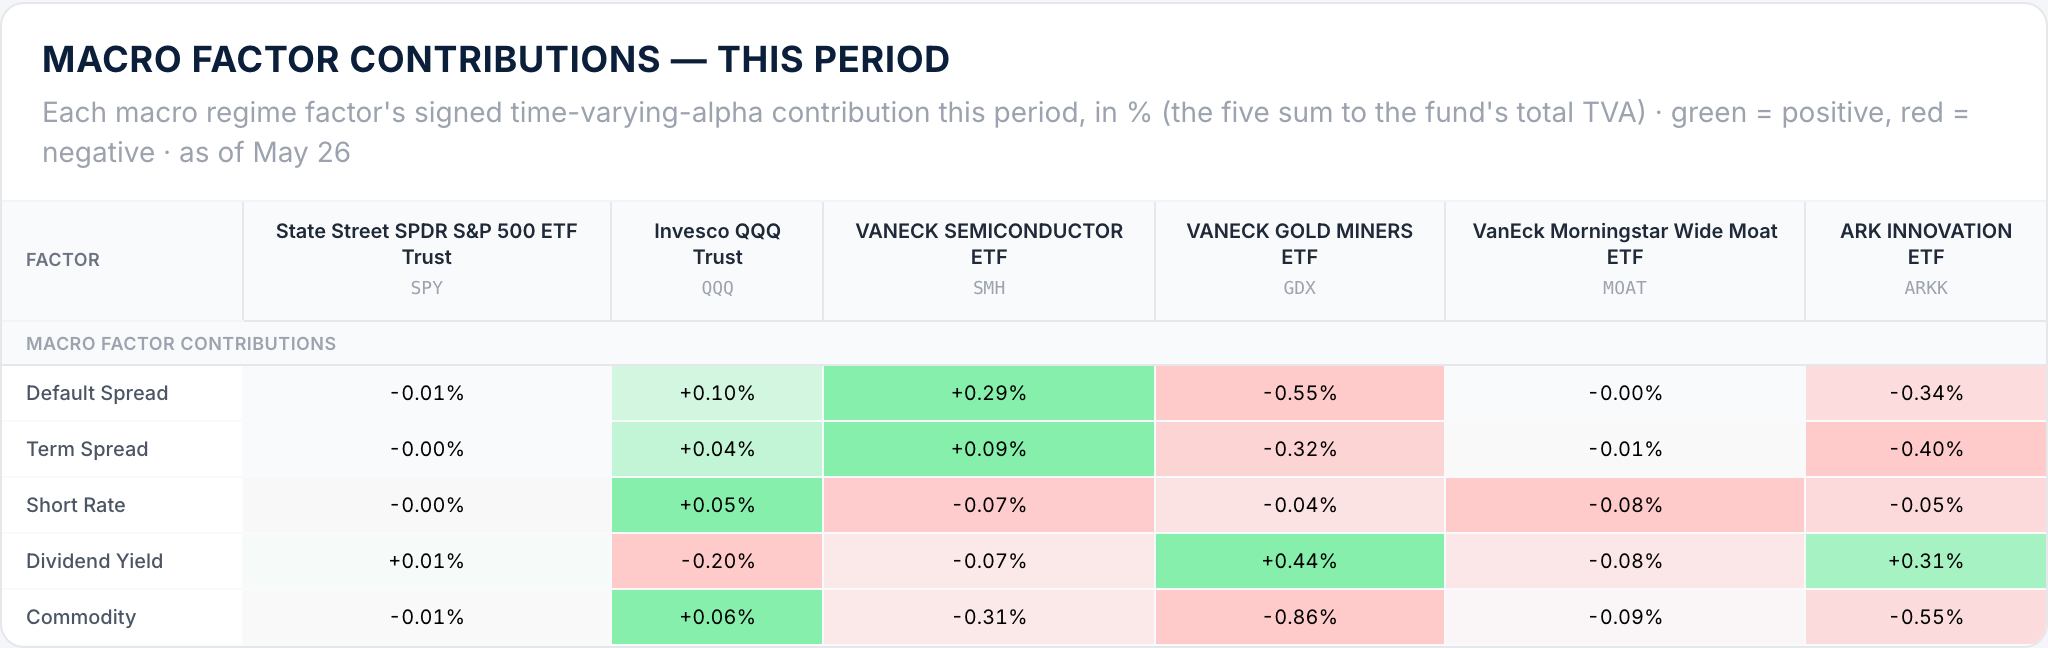
Most models estimate one static alpha per fund. AlphaPredictor® splits it in two: all-weather alpha, earned in any environment, and time-varying alpha — the part a fund earns in this macro environment, driven by its sensitivity to five regime factors: default spread, term spread, short rate, dividend yield and commodities.

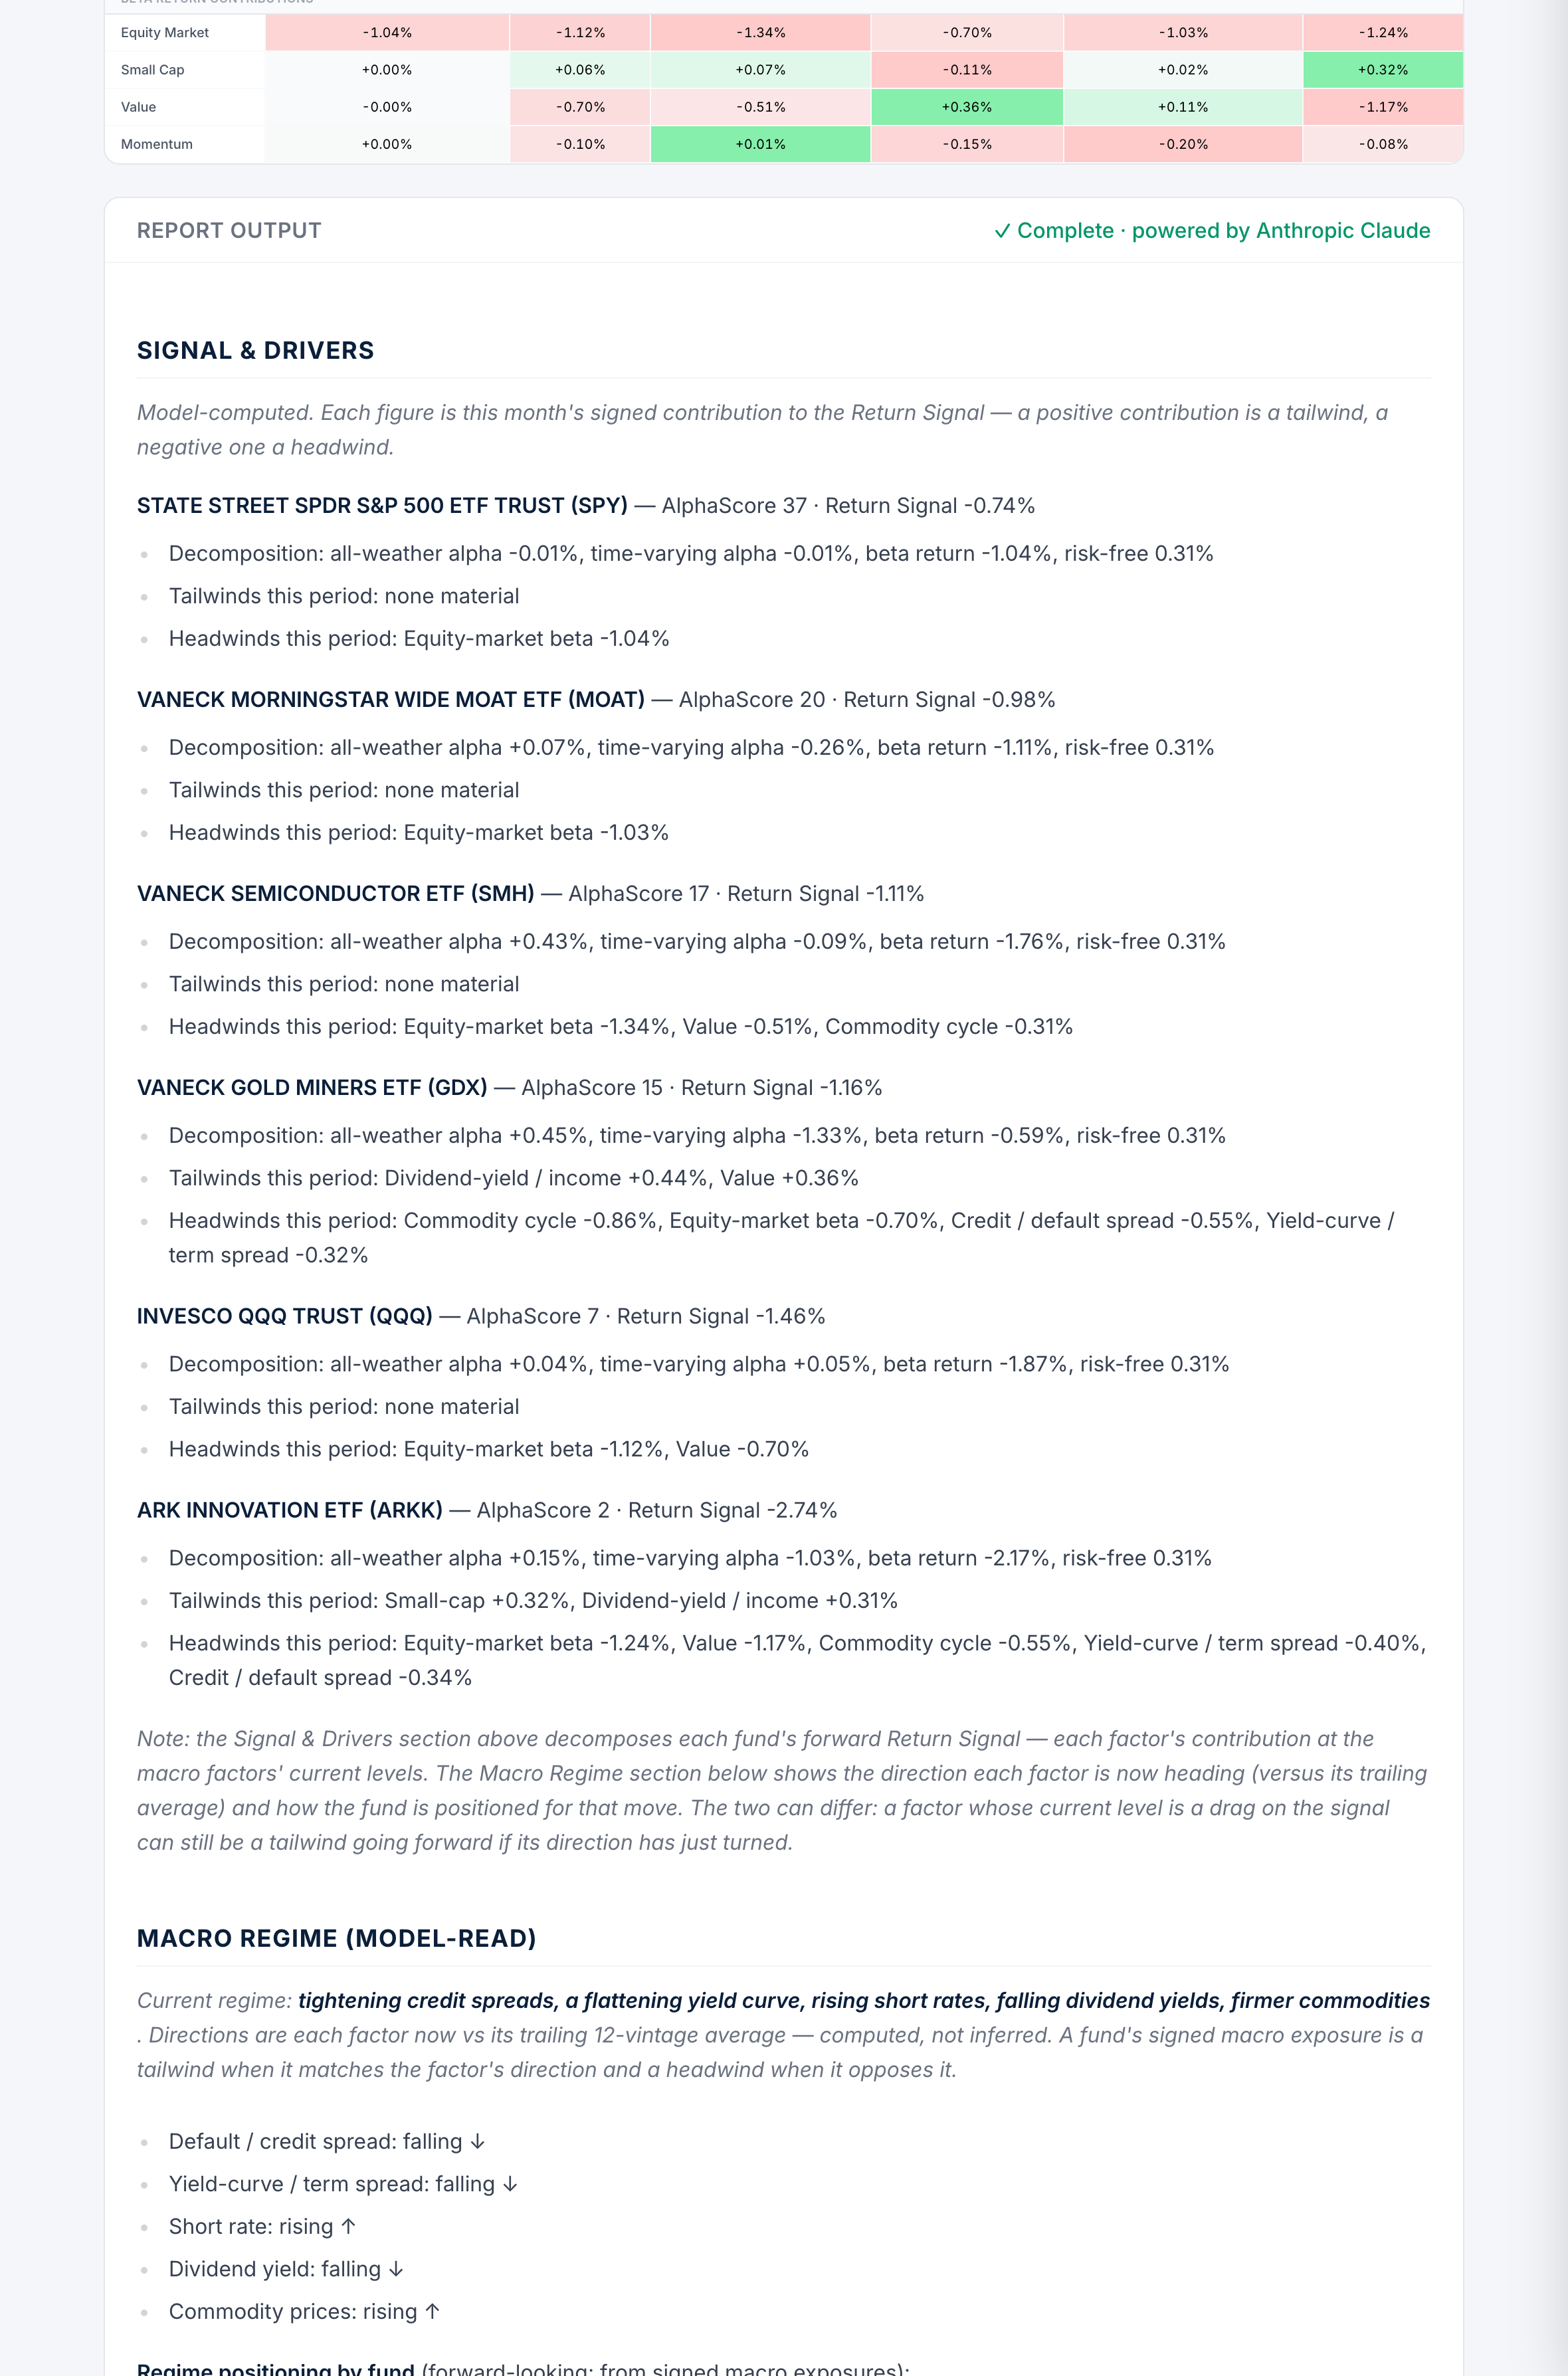
Below, each fund's monthly Return Signal is split into the contribution from every regime factor — green where a factor added to the signal this month, red where it subtracted. The model re-estimates these as the regime shifts.
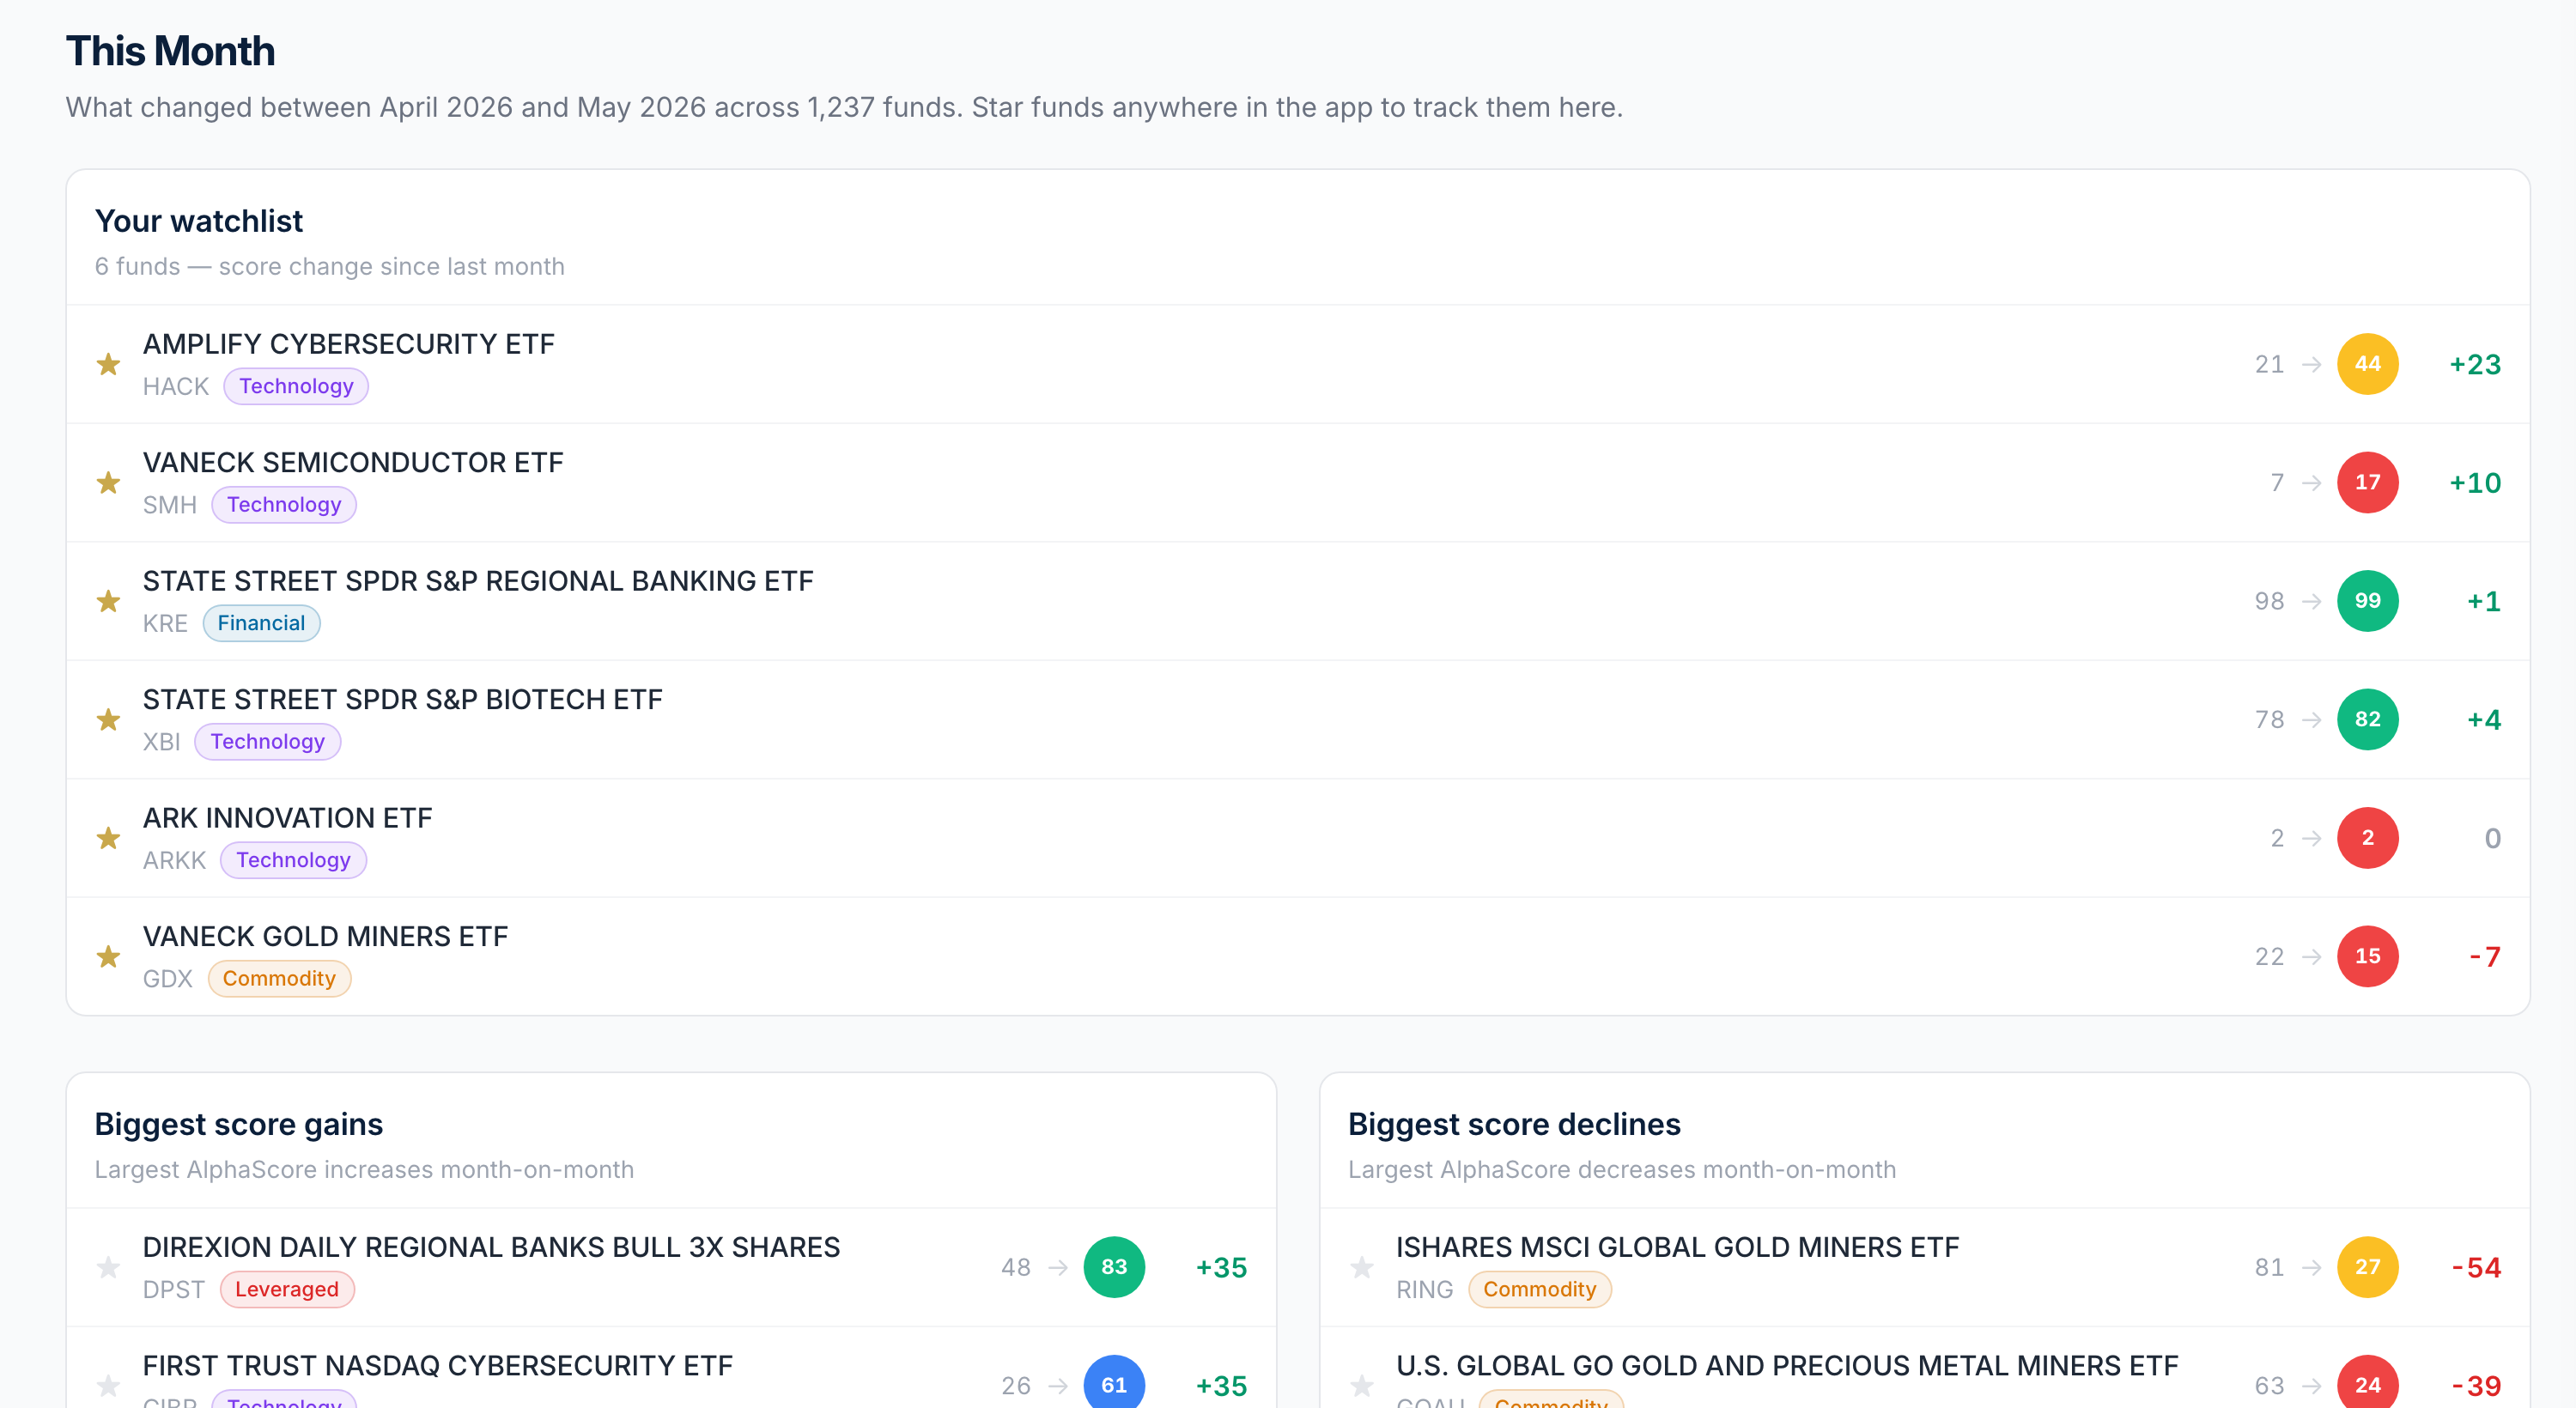
Macro factor contributions — this period (%)
Macro factor contribution heat map — each regime factor's signed contribution (green positive, red negative) to the monthly Return Signal for XBI, VDC, VPU, XLE, SMH, SCHD, VGT and QQQ

The AlphaScore™

A single, defensible number for every fund

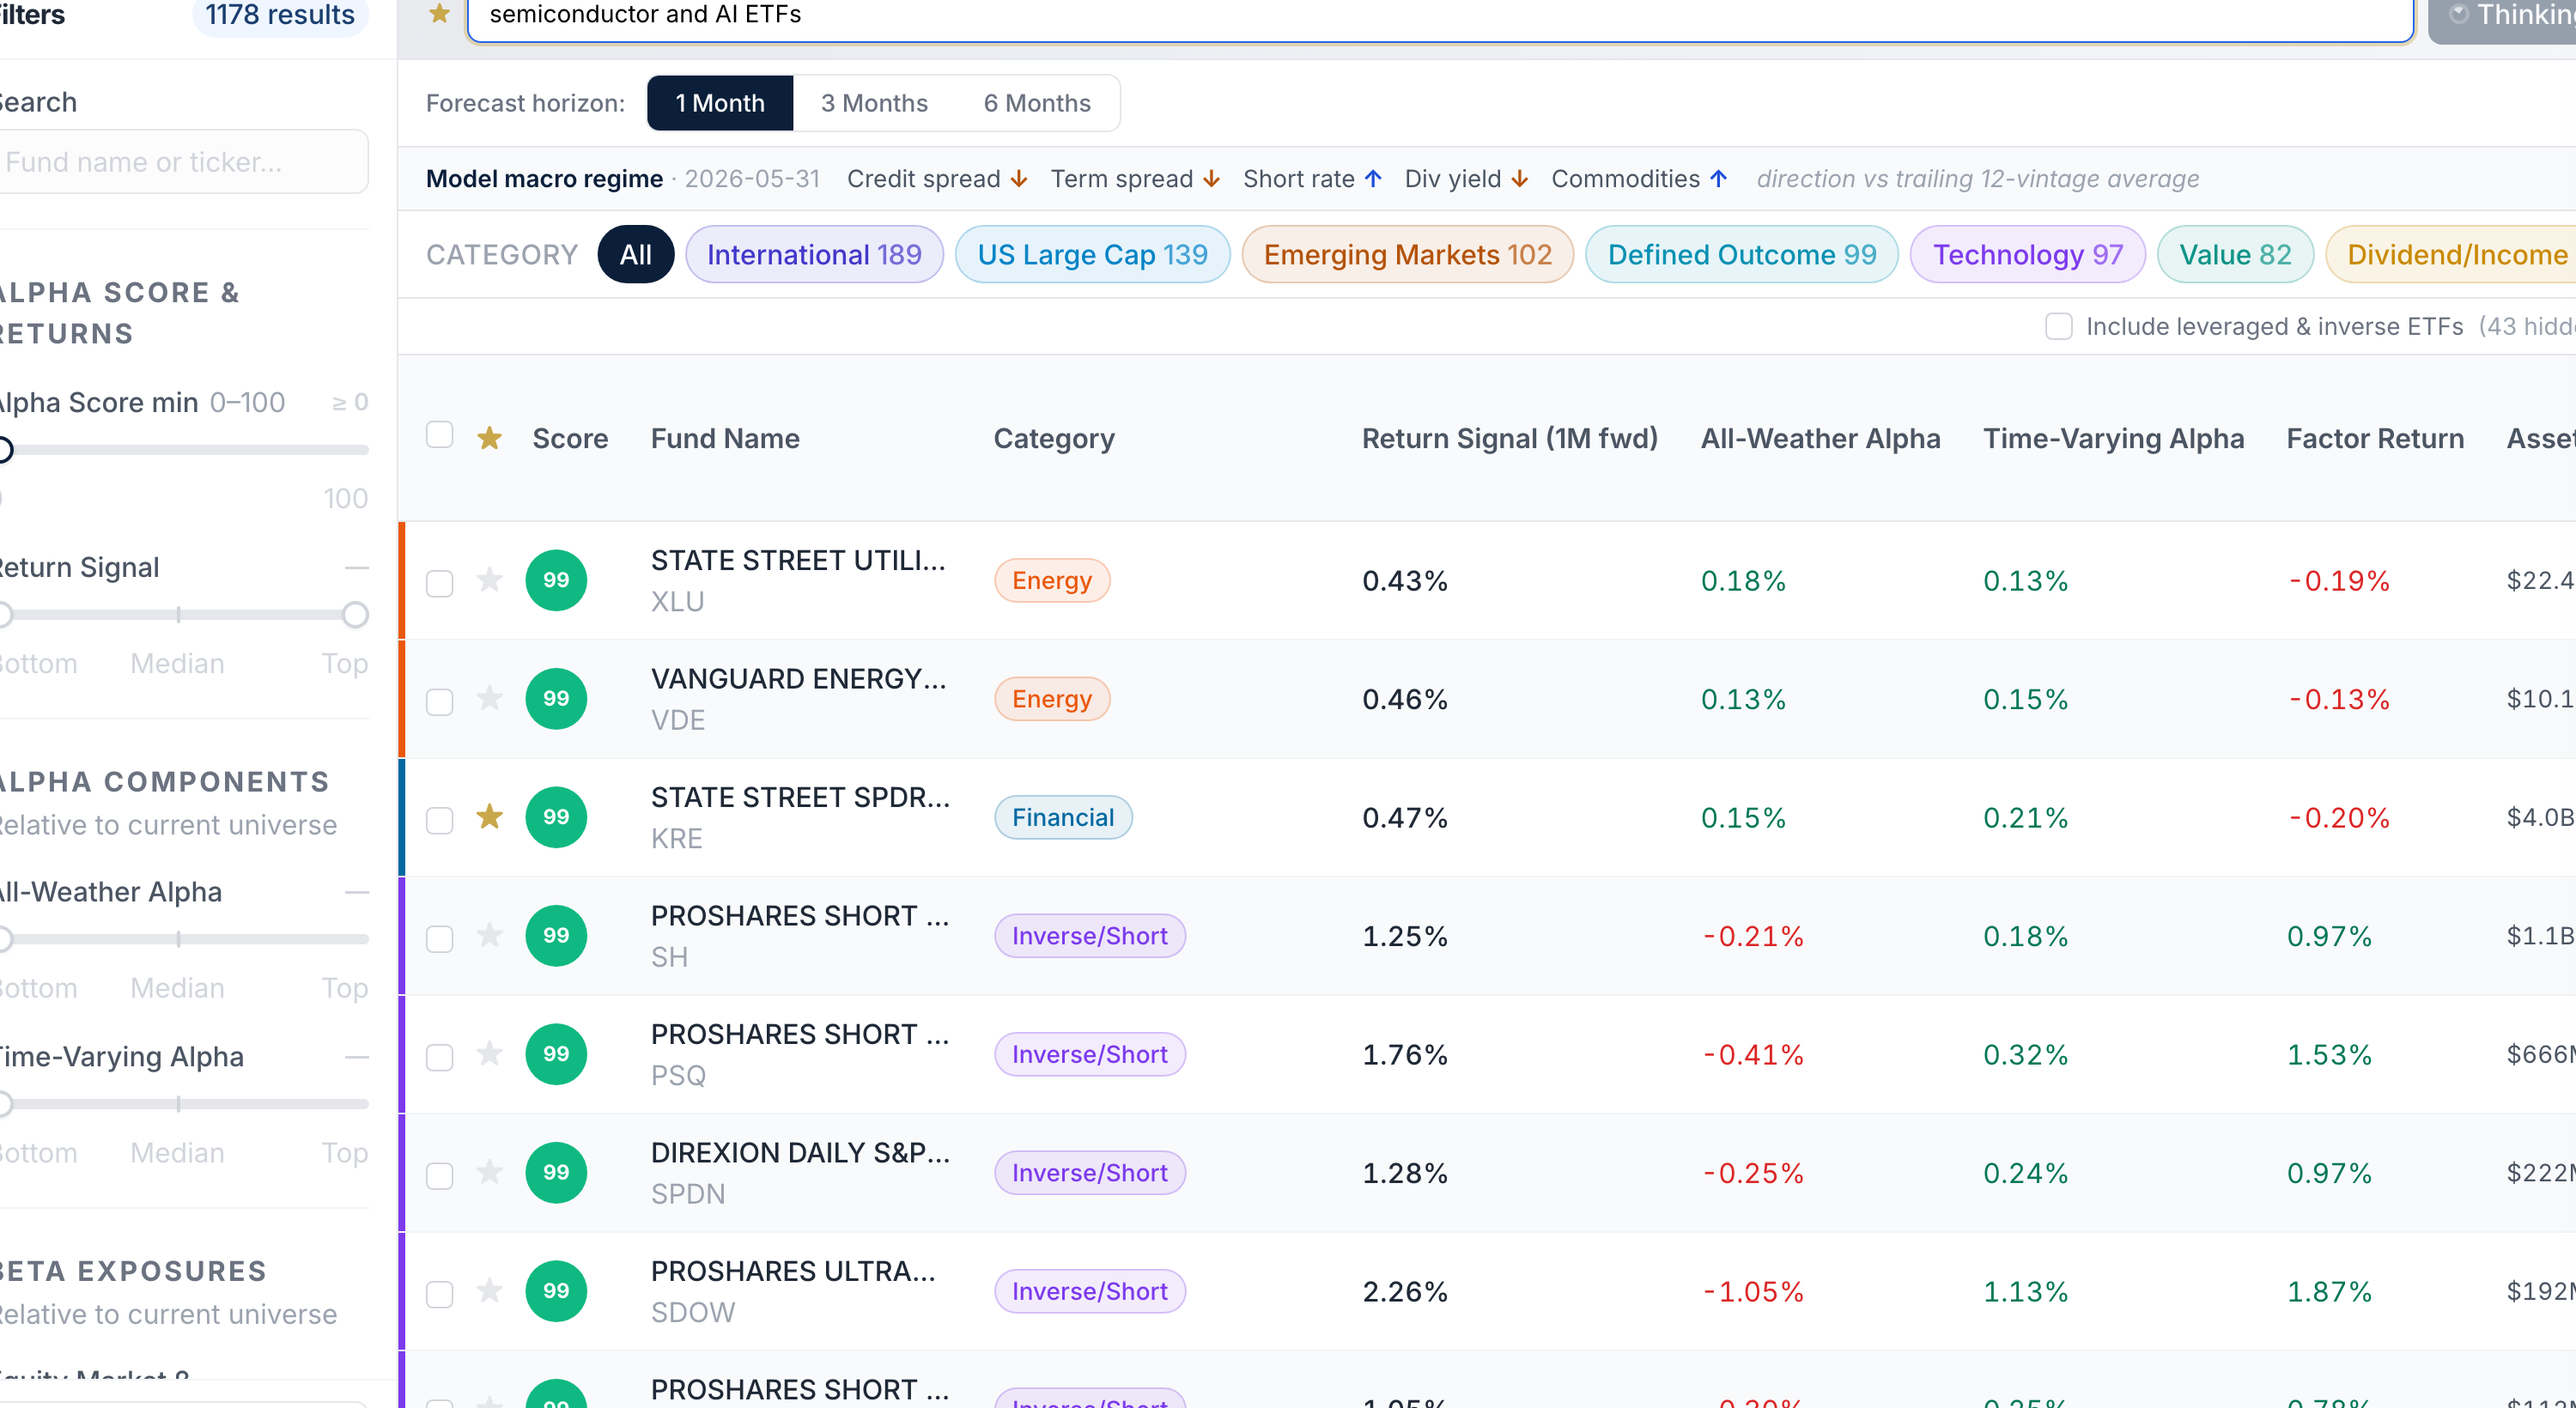
Every ETF's return signal for the coming month is ranked into a percentile against the full universe — 100 = the strongest signal, 0 = the weakest — and broken into the components that drive it: all-weather alpha, time-varying alpha, and factor return. Sort 1,221 funds in one view, or filter to a category and find the strongest names instantly.

  • Return signal decomposed into alpha vs beta, not a black box
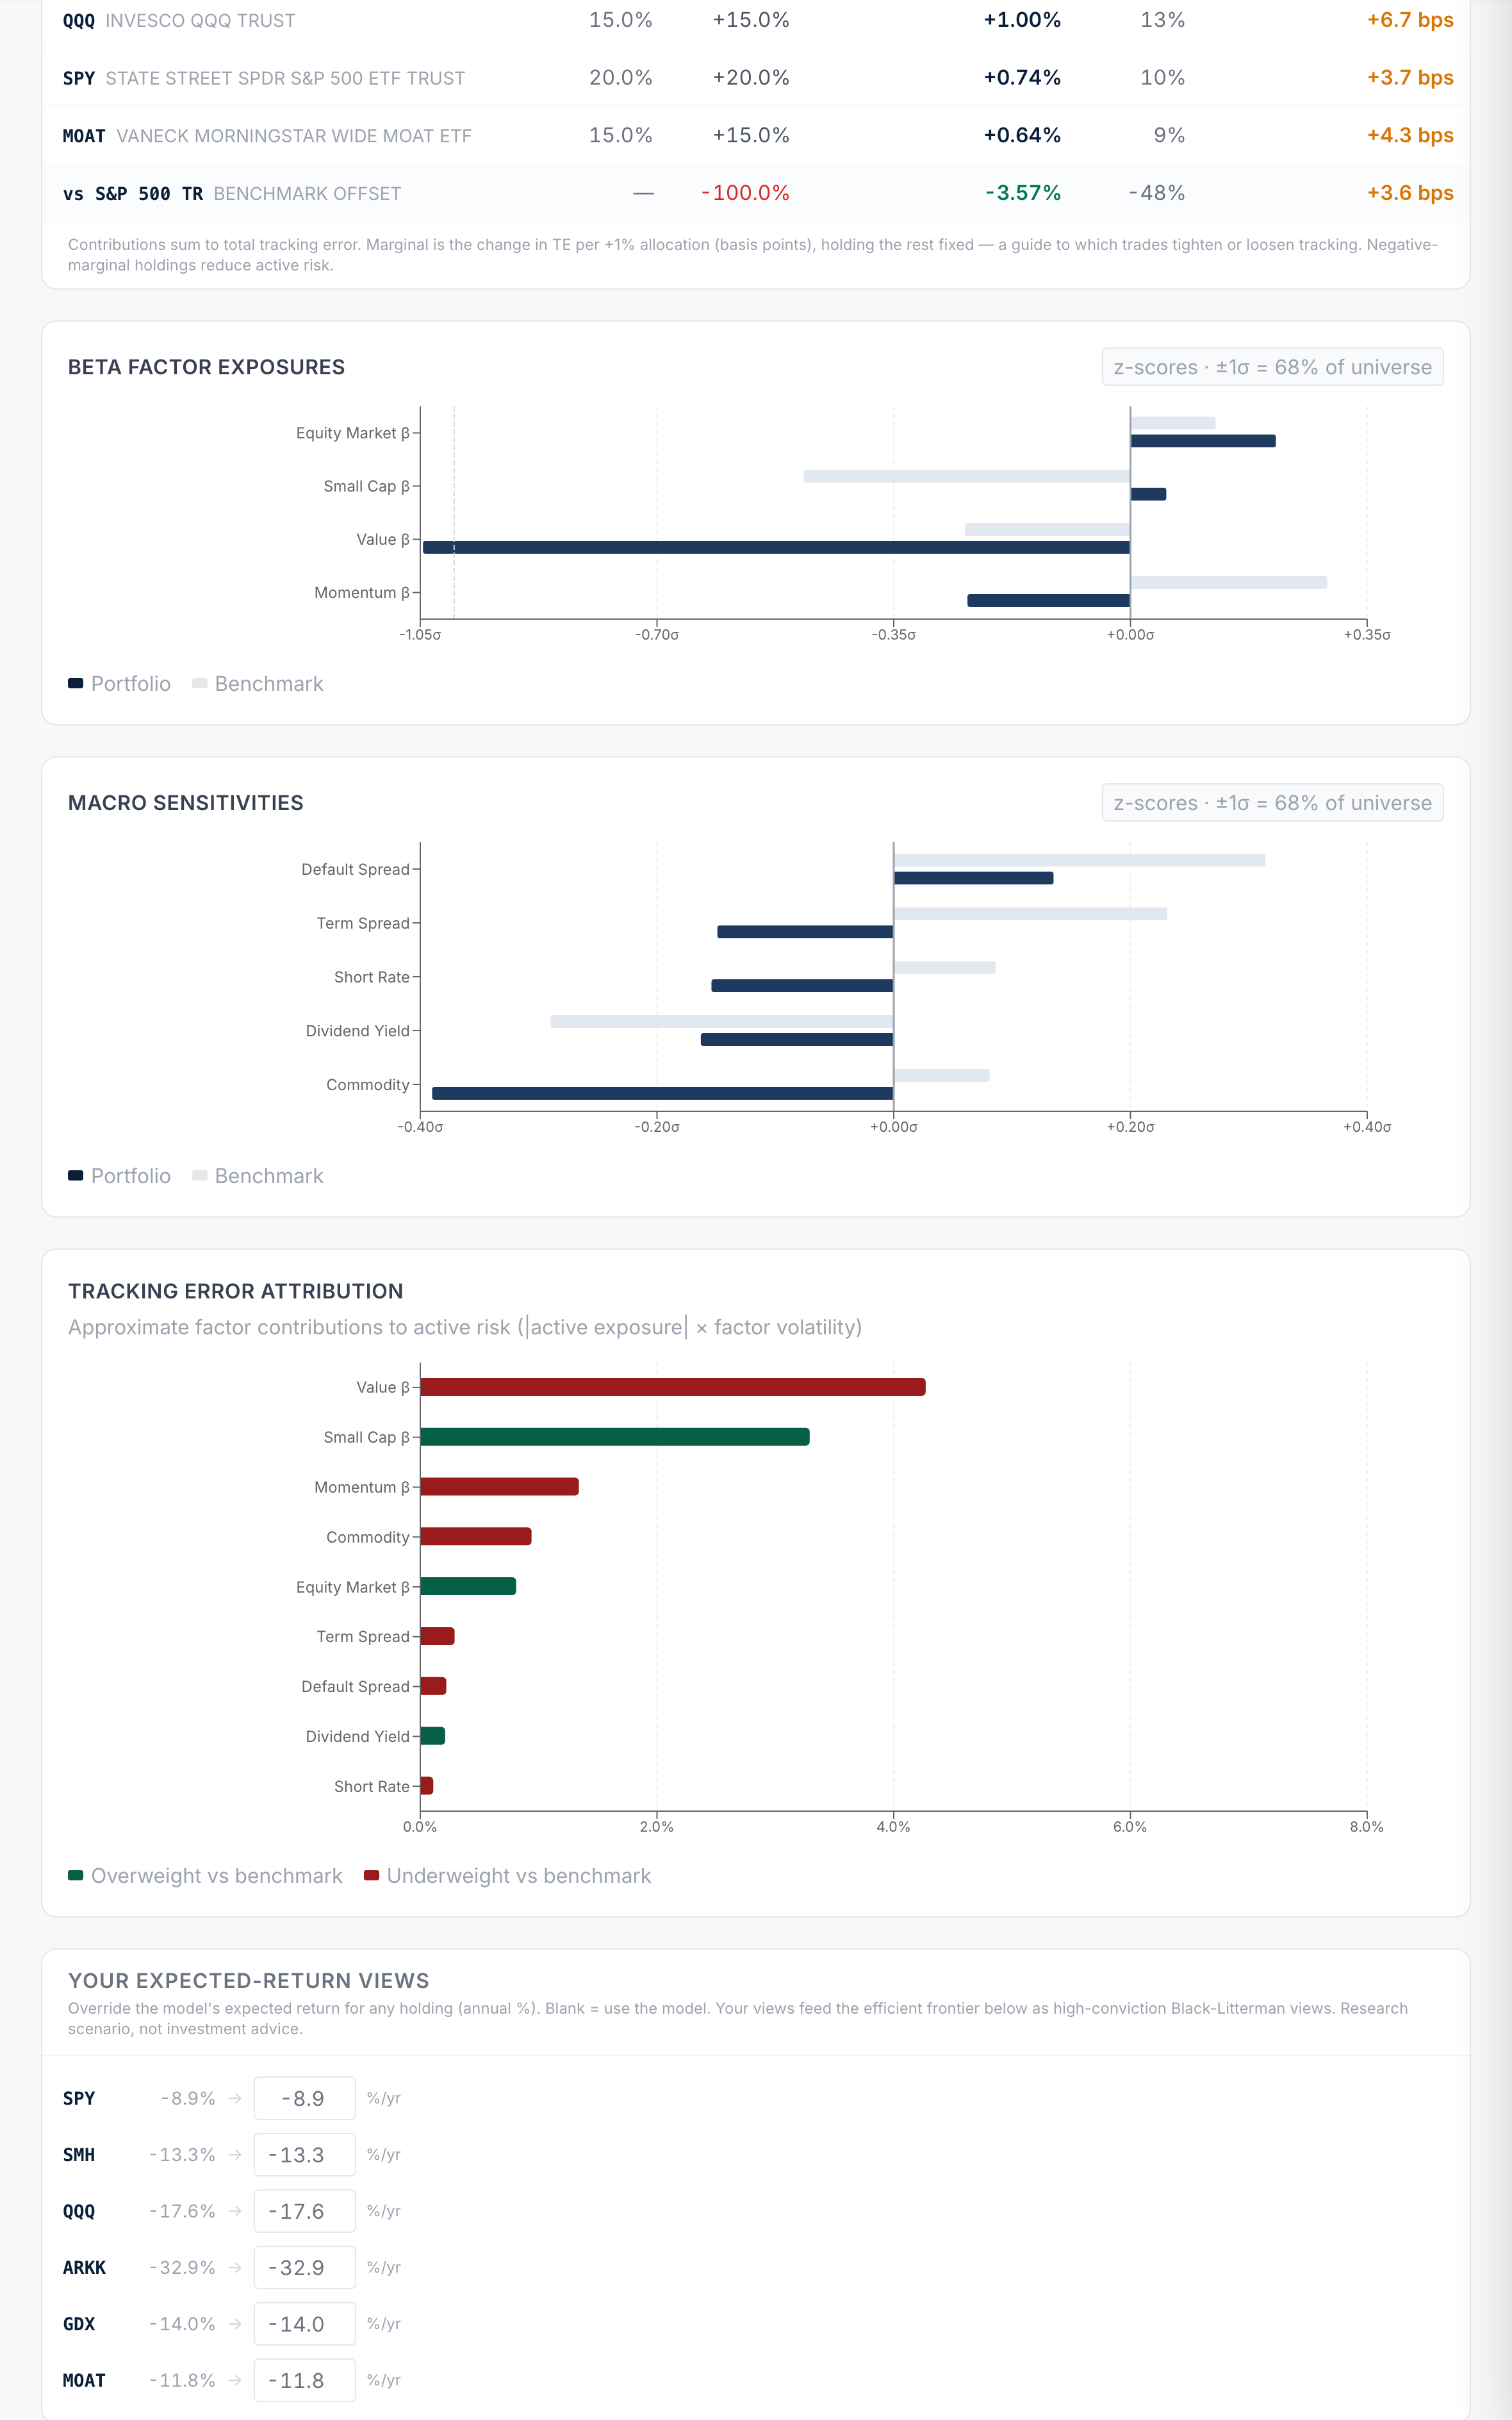
  • Factor and macro exposures as z-scores against the whole universe
  • Natural-language screening — "cheapest tech with strong momentum"
ETF Screener — "cheapest tech ETFs with strong momentum"
Natural-language screening: the query 'cheapest tech ETFs with strong momentum' applied as a structured sort and Technology filter, with top-scoring funds and their expected-return decomposition

Drill into any fund

Every number traceable to the model

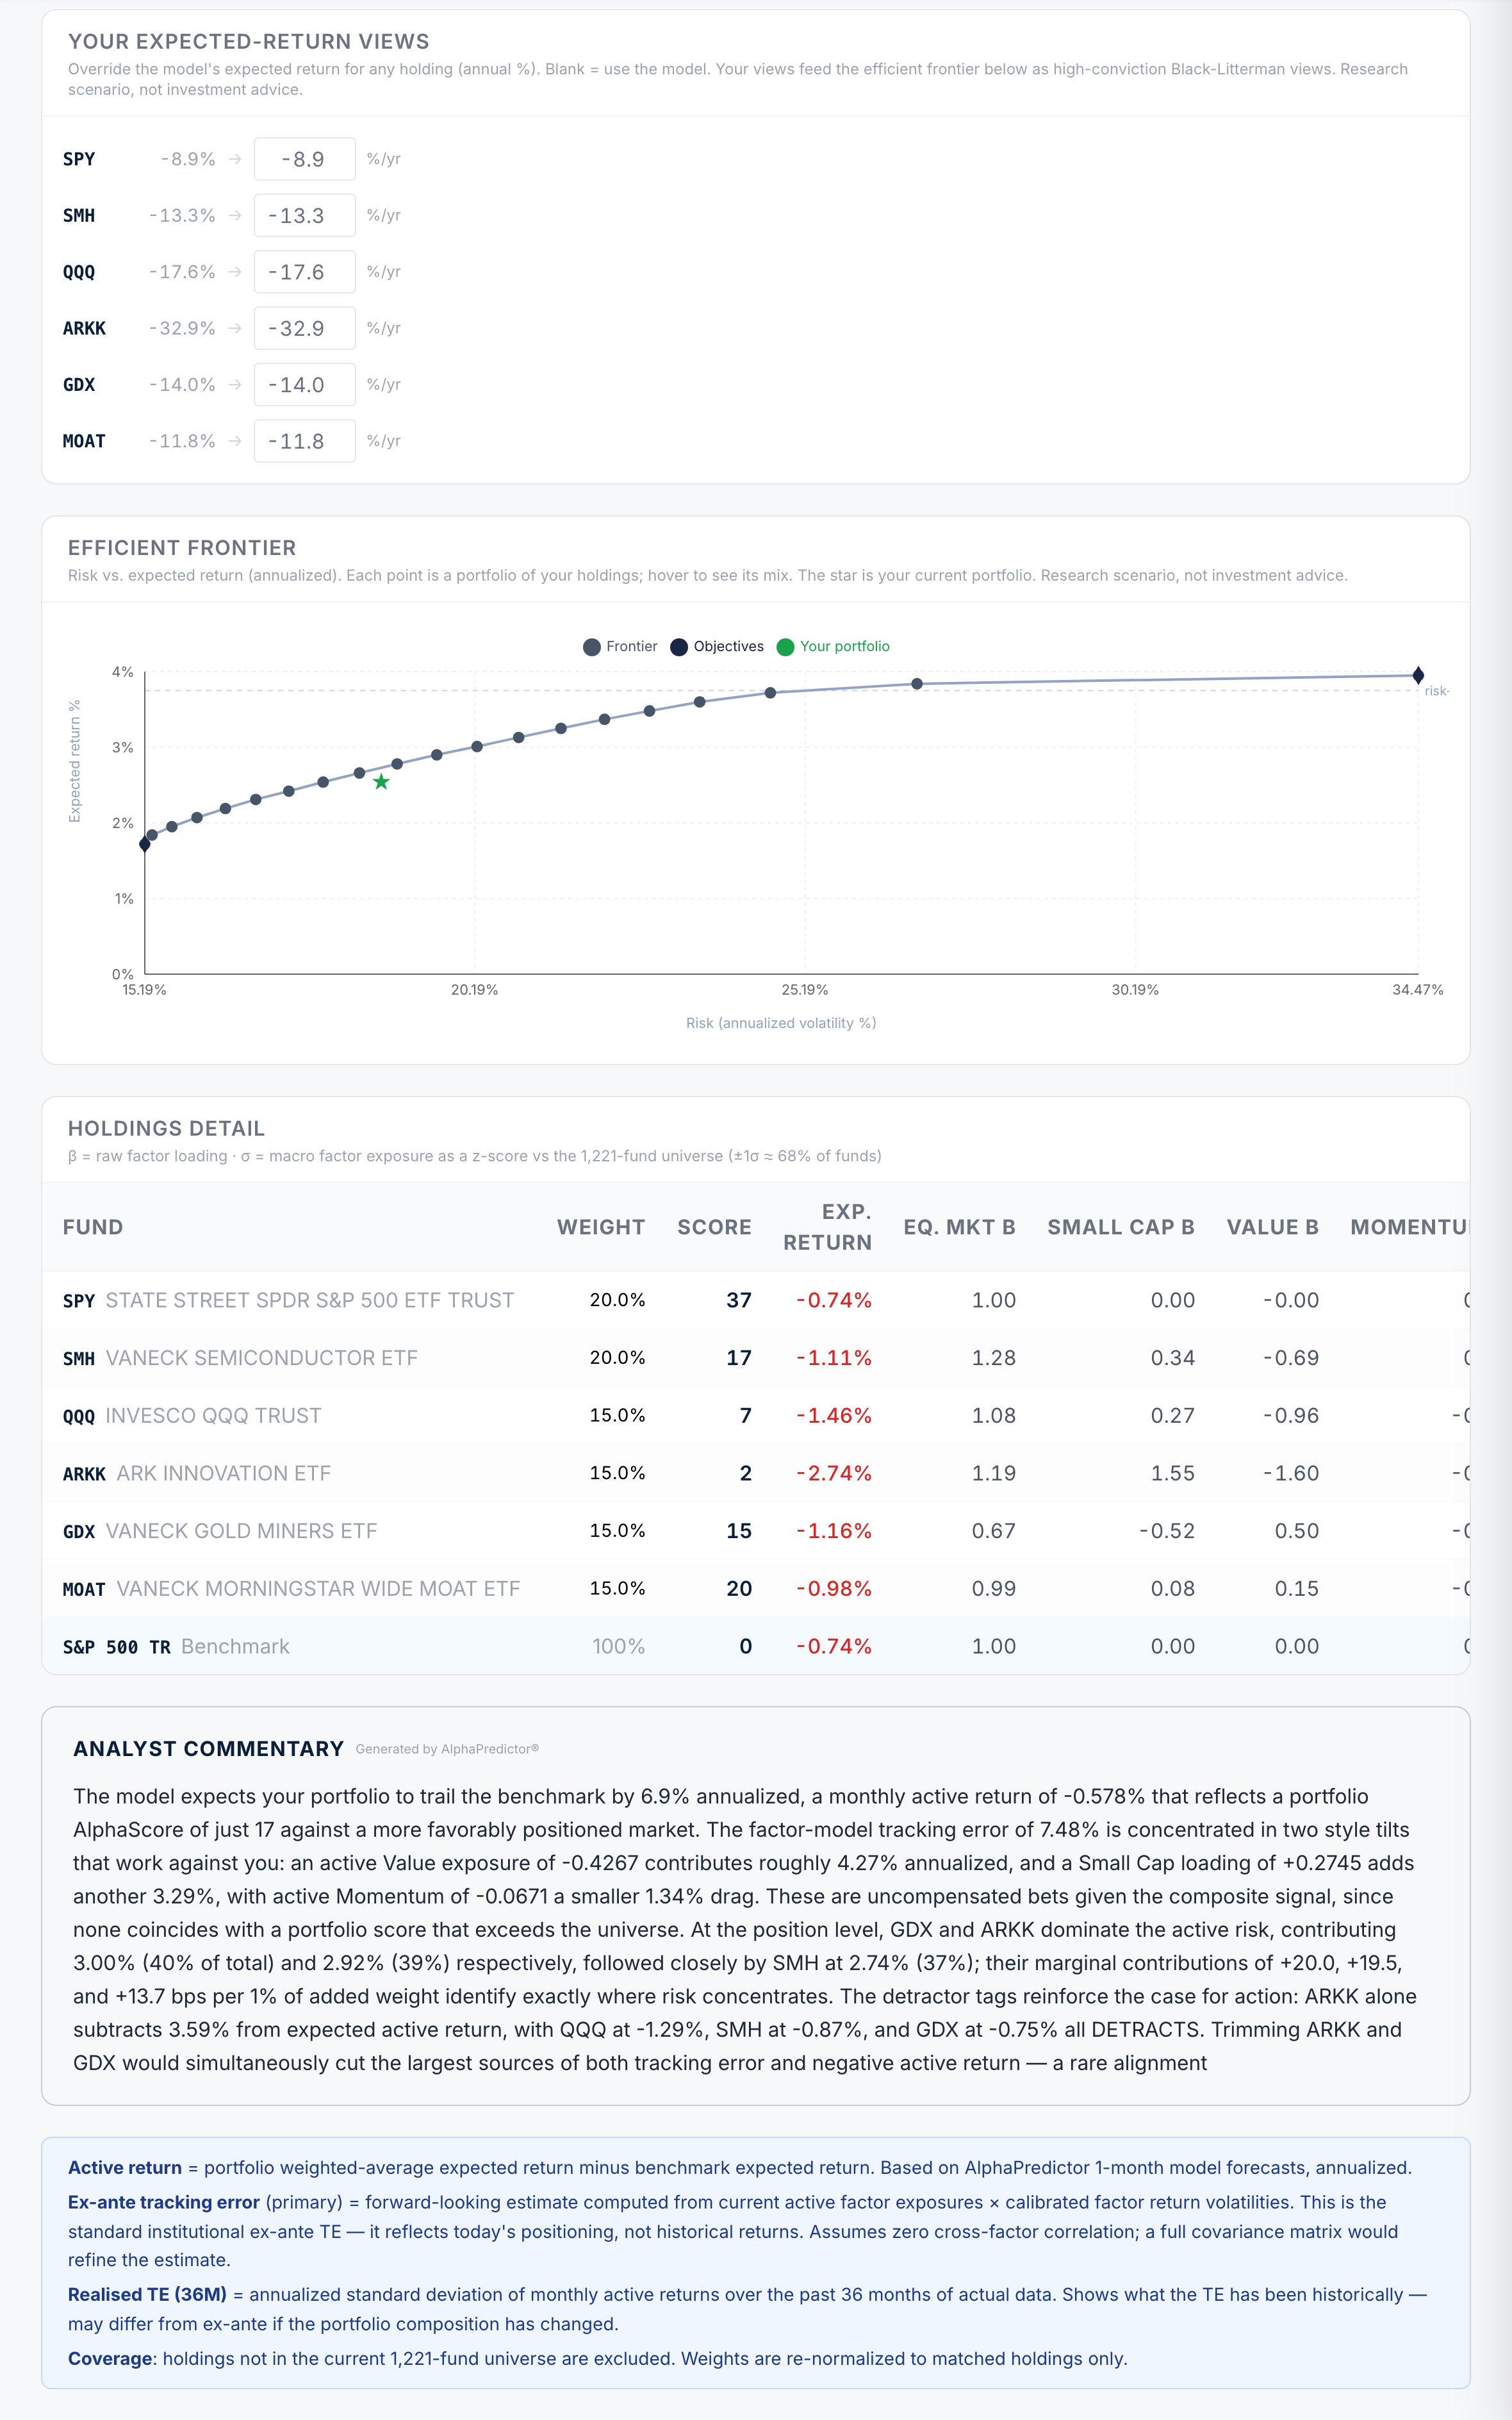
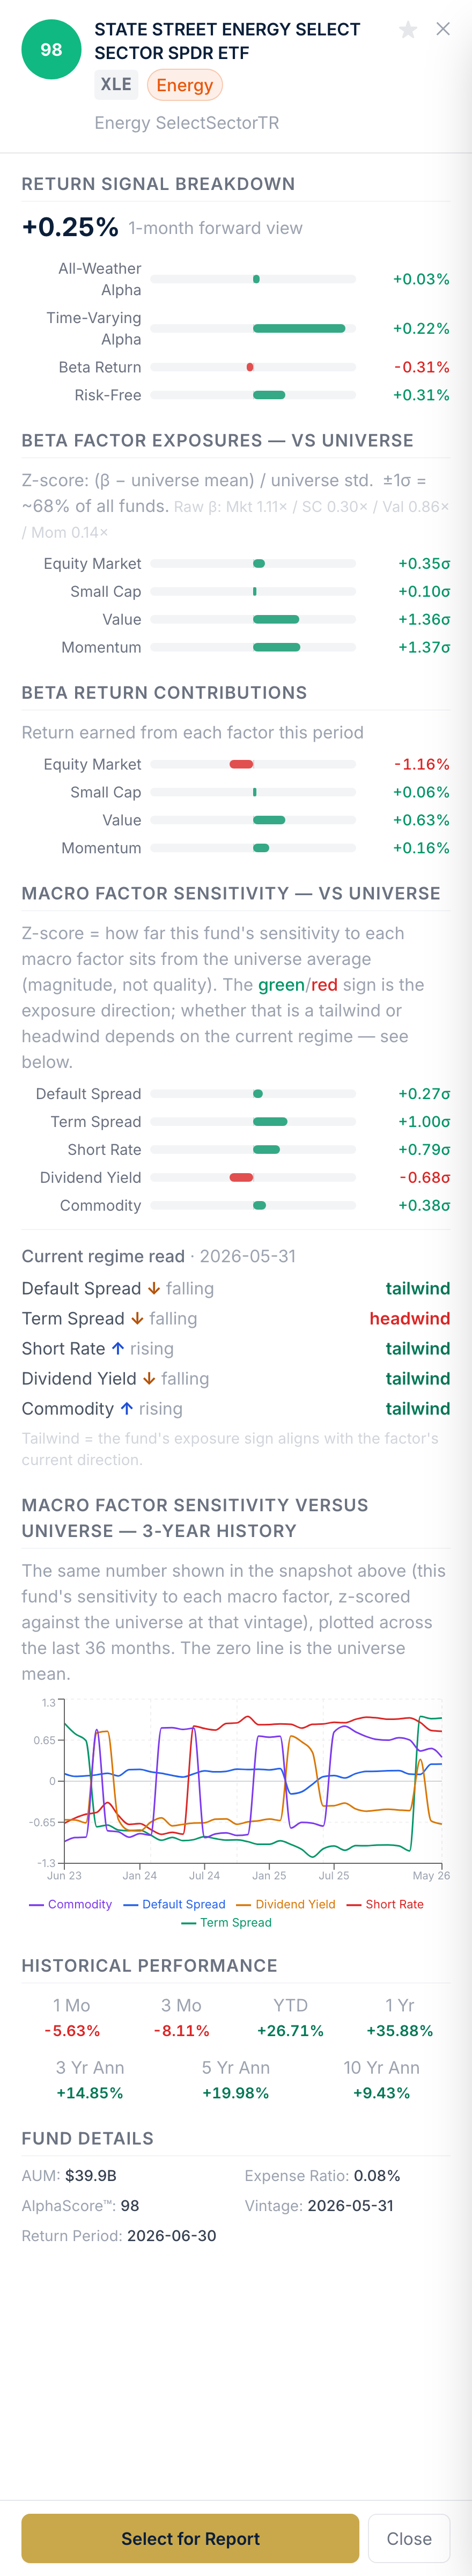
Click a fund and the full picture opens: the return signal broken into all-weather alpha, time-varying alpha, factor return and the risk-free rate — then the factor and macro exposures behind it, each scored against the whole universe. Here, energy's XLE earns a 98 AlphaScore from a positive alpha and value tilt, even as its equity-market beta is a drag this month.

  • Expected-return waterfall: where every basis point comes from
  • Beta and macro sensitivities as ±σ z-scores vs all 1,221 funds
  • Trailing performance, AUM, expense ratio and benchmark in one place
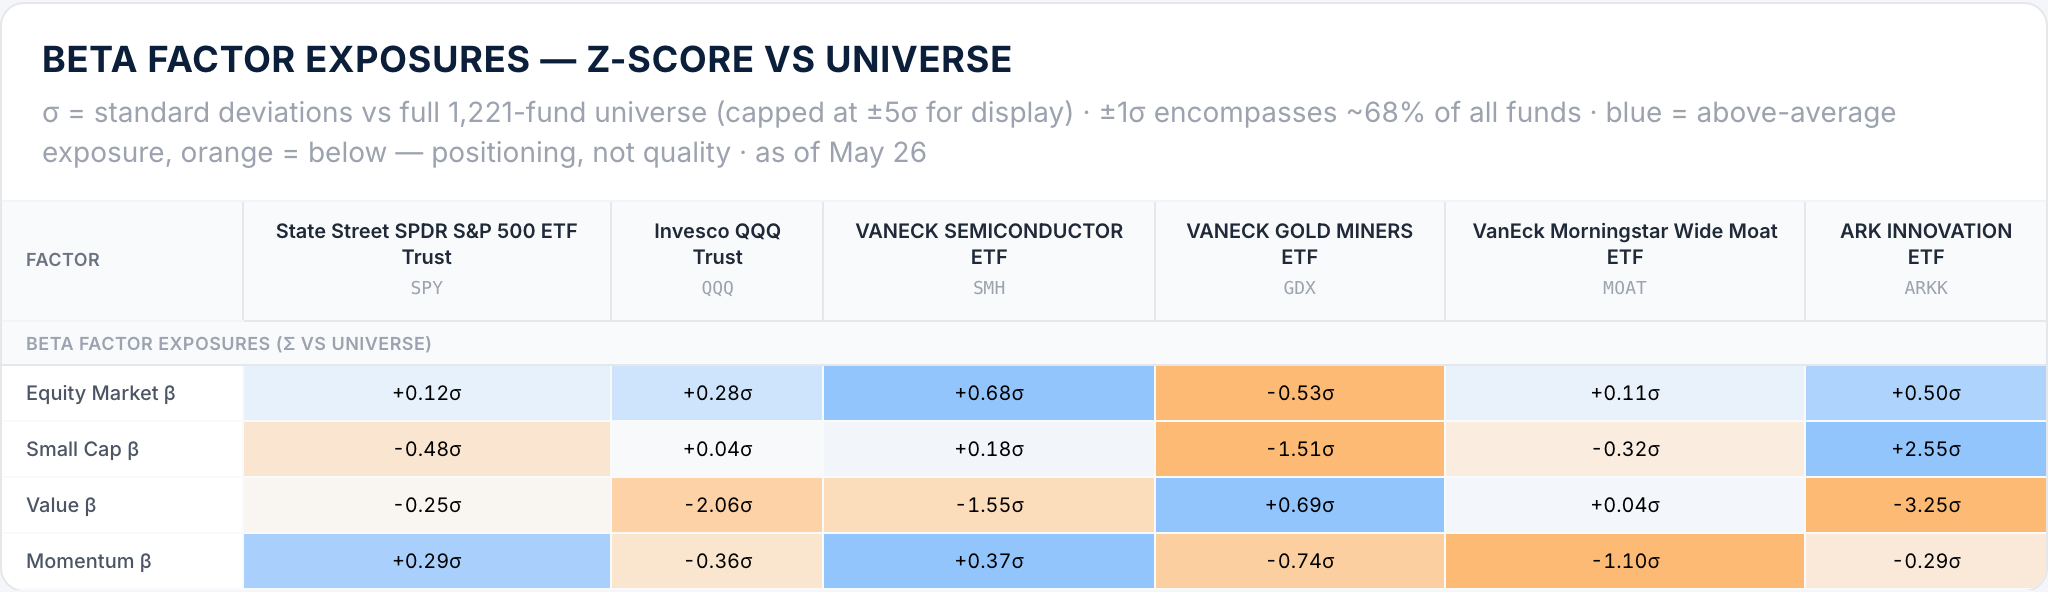
XLE — fund detail
Fund detail panel for XLE showing AlphaScore 95, expected-return breakdown, factor exposure z-scores and macro sensitivities

Factor heat maps

Every exposure, mapped against the universe

See each fund's tilt to the equity-market, size, value and momentum factors as z-scores against all 1,221 funds. Blue runs above average, orange below, so a peer group's positioning reads in a single glance.
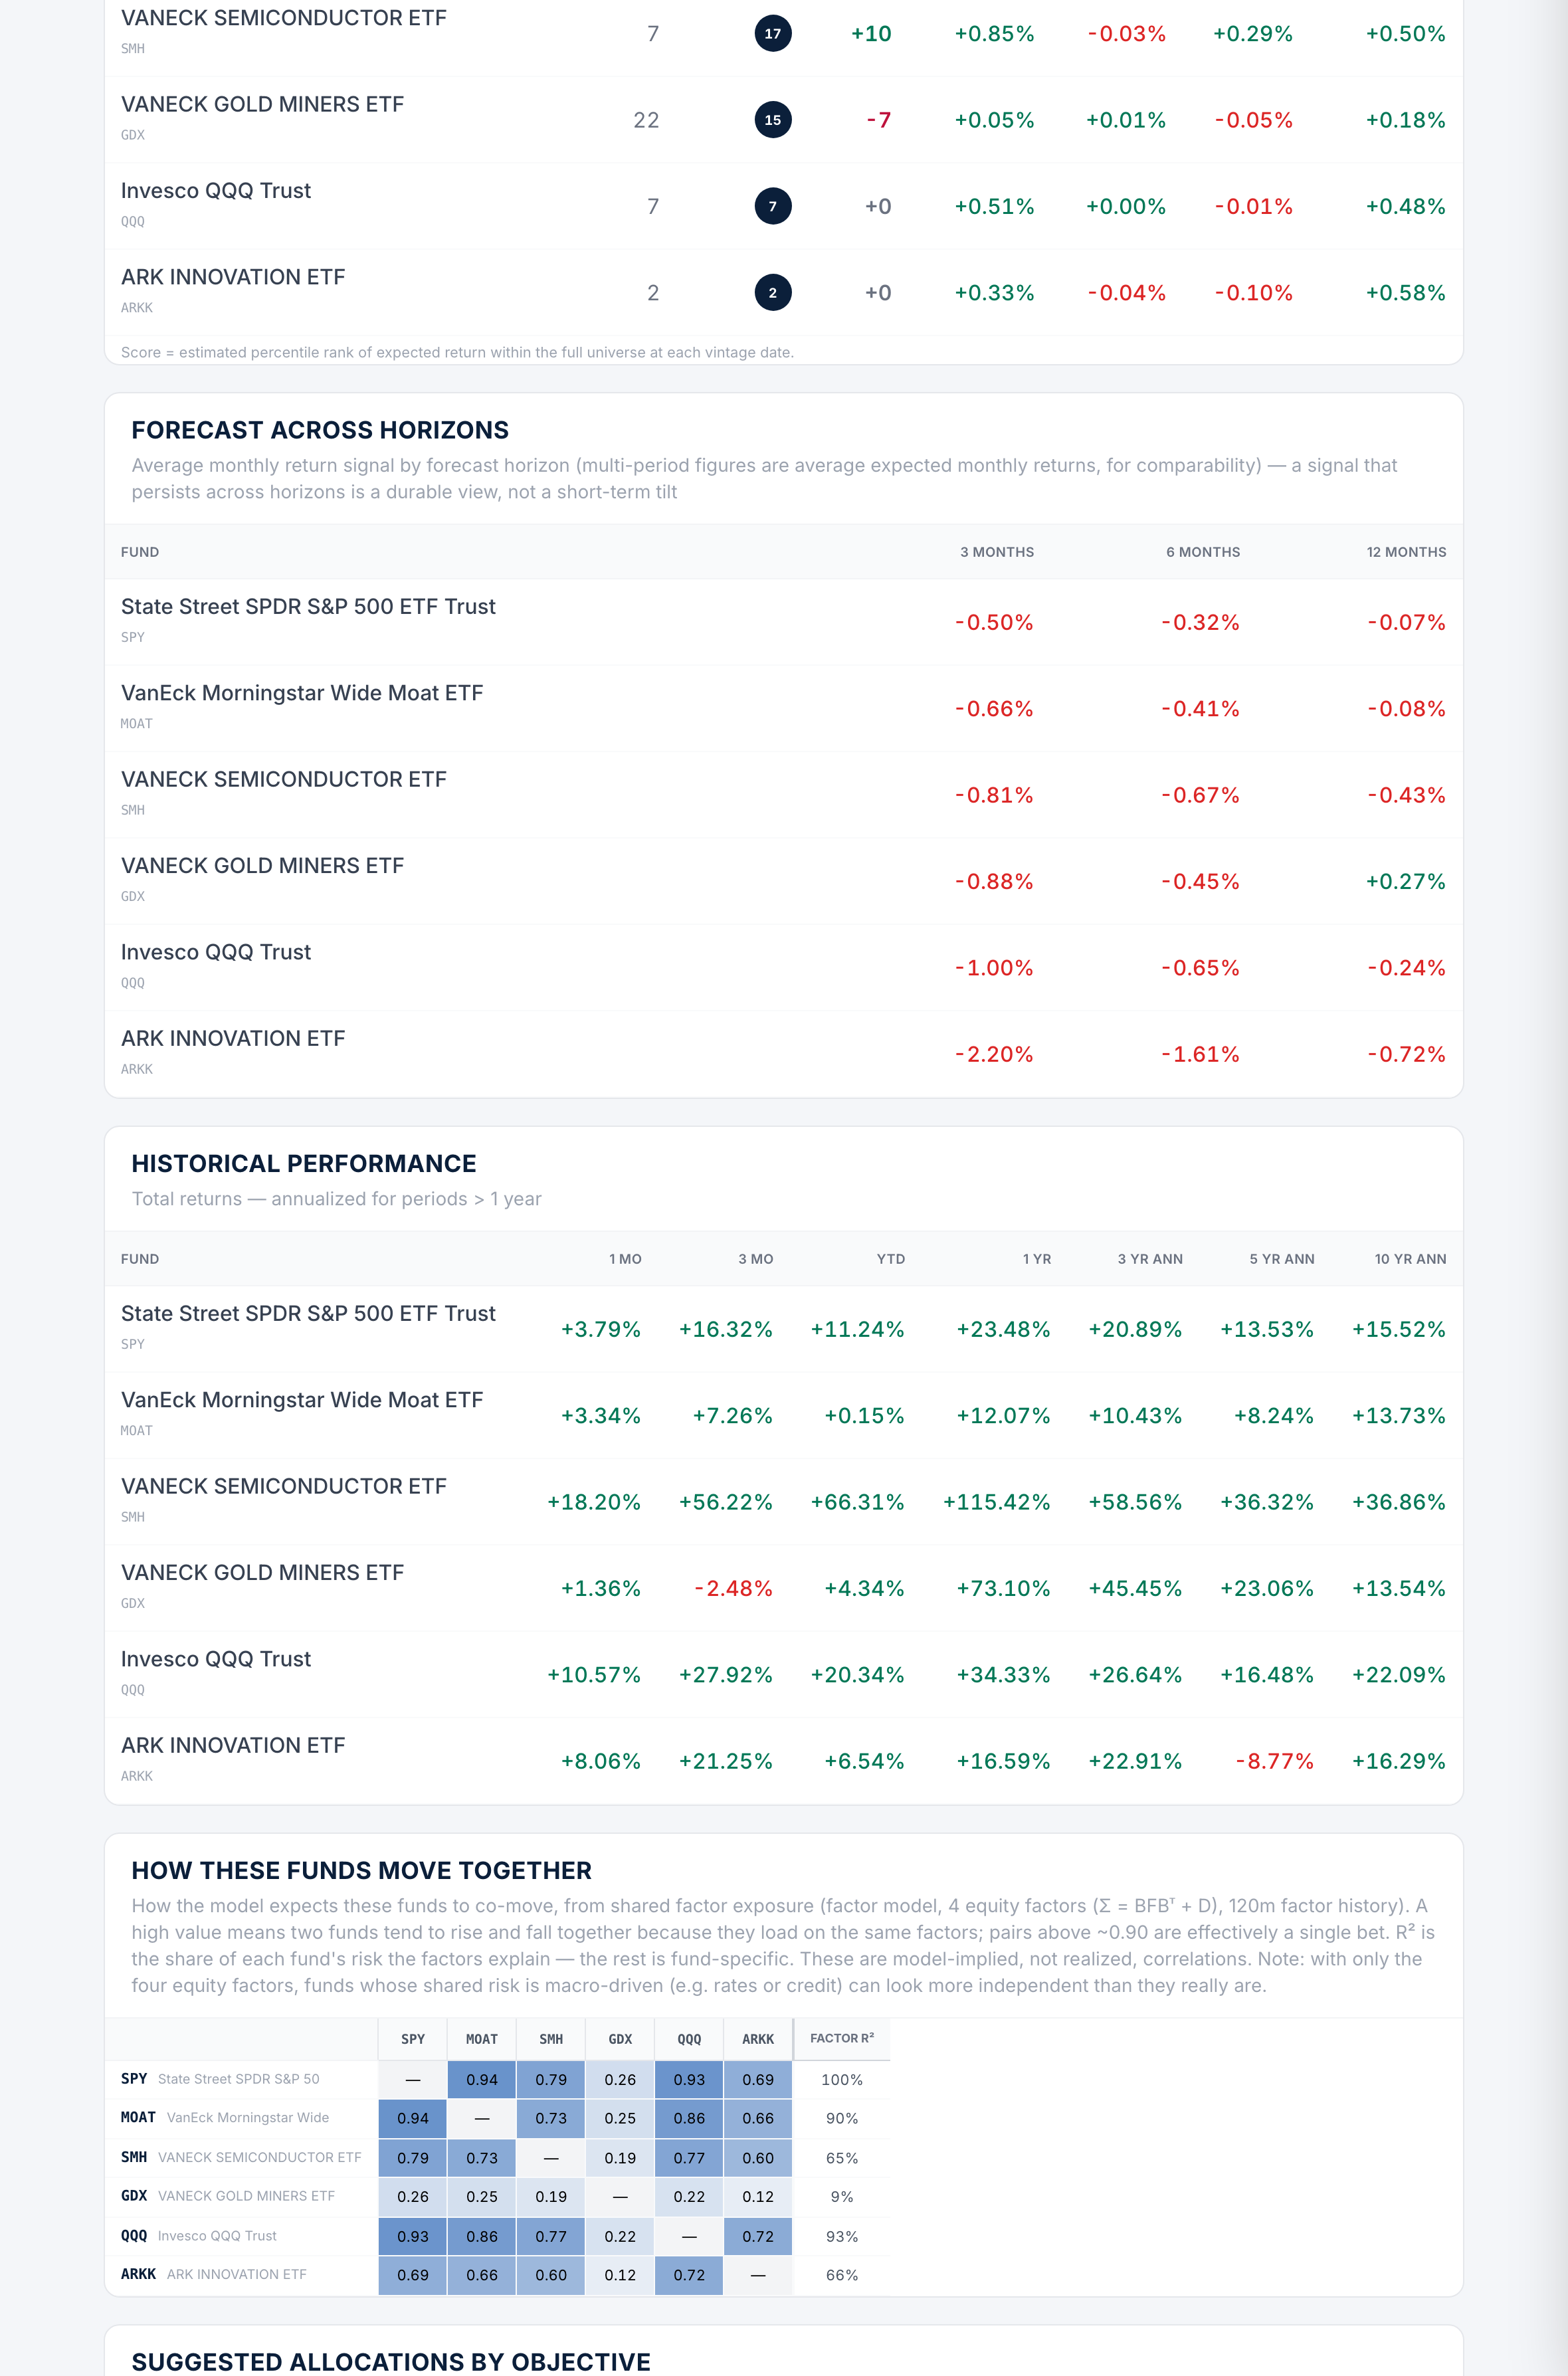
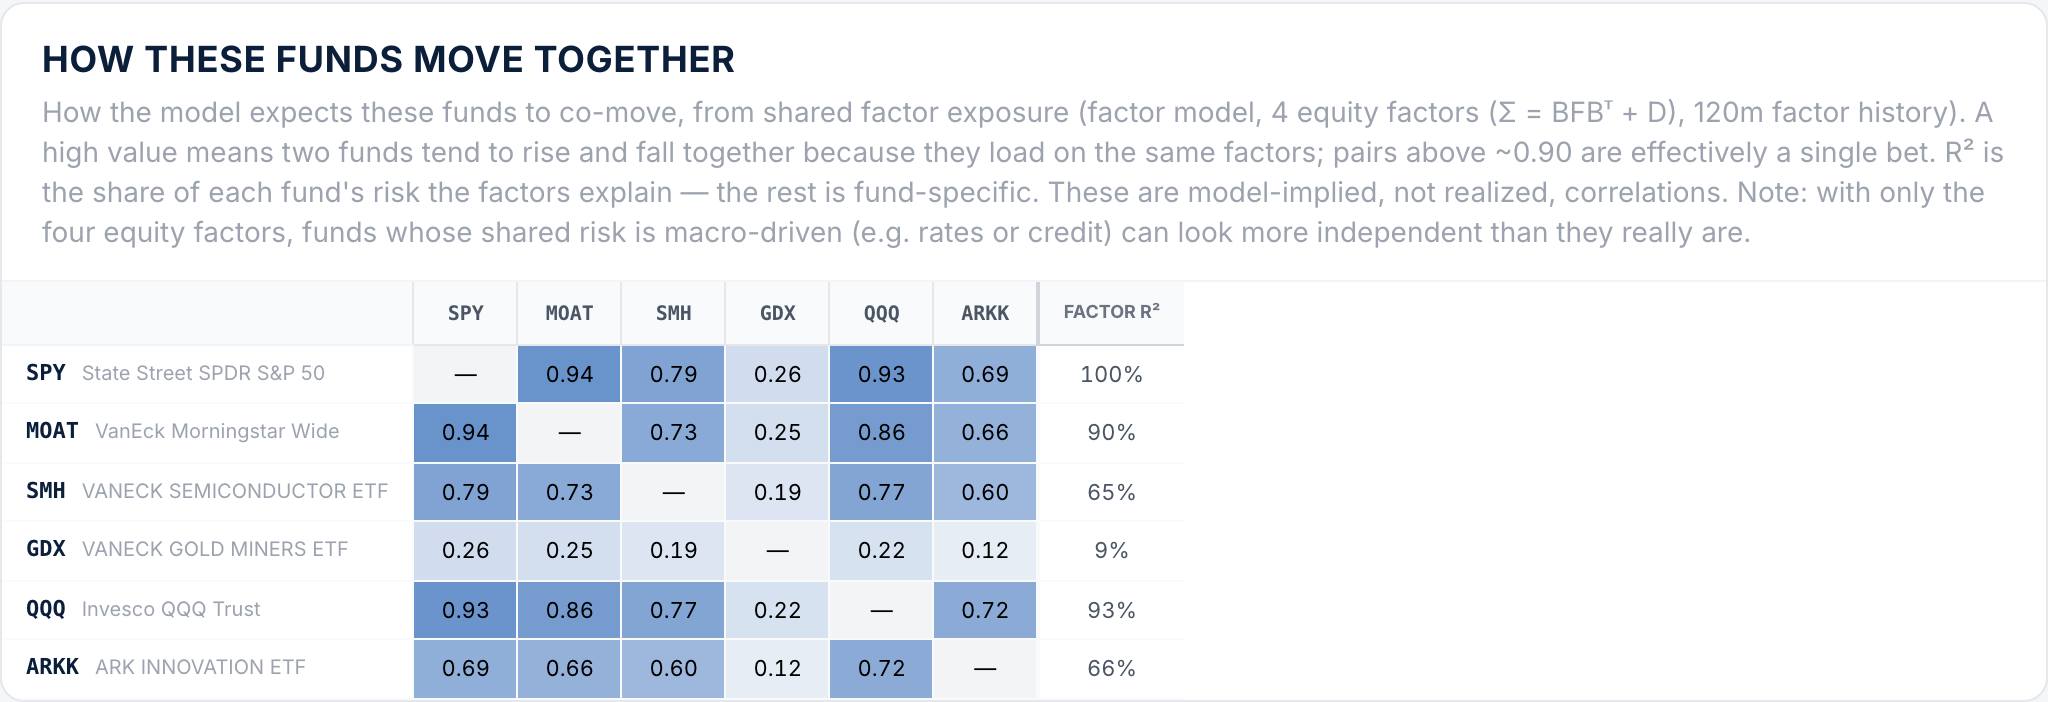
Factor exposures — z-score vs universe
Beta factor exposure heat map for XBI, VDC, VPU, XLE, SMH, SCHD, VGT and QQQ

See the overlap

Know which bets are really the same bet

A factor-structured covariance shows how any set of funds actually move together — and how much of each fund's risk is explained by the four equity factors. Below, VGT and QQQ correlate 0.90 — near-duplicates — while energy and utilities diversify the book. It's the diversification check most screeners can't do.

How these funds move together
Factor-implied correlation matrix for XLE, VPU, VDC, SCHD, XBI, VGT, QQQ and SMH

Portfolio analyzer

Build it, stress-test it, see what to change

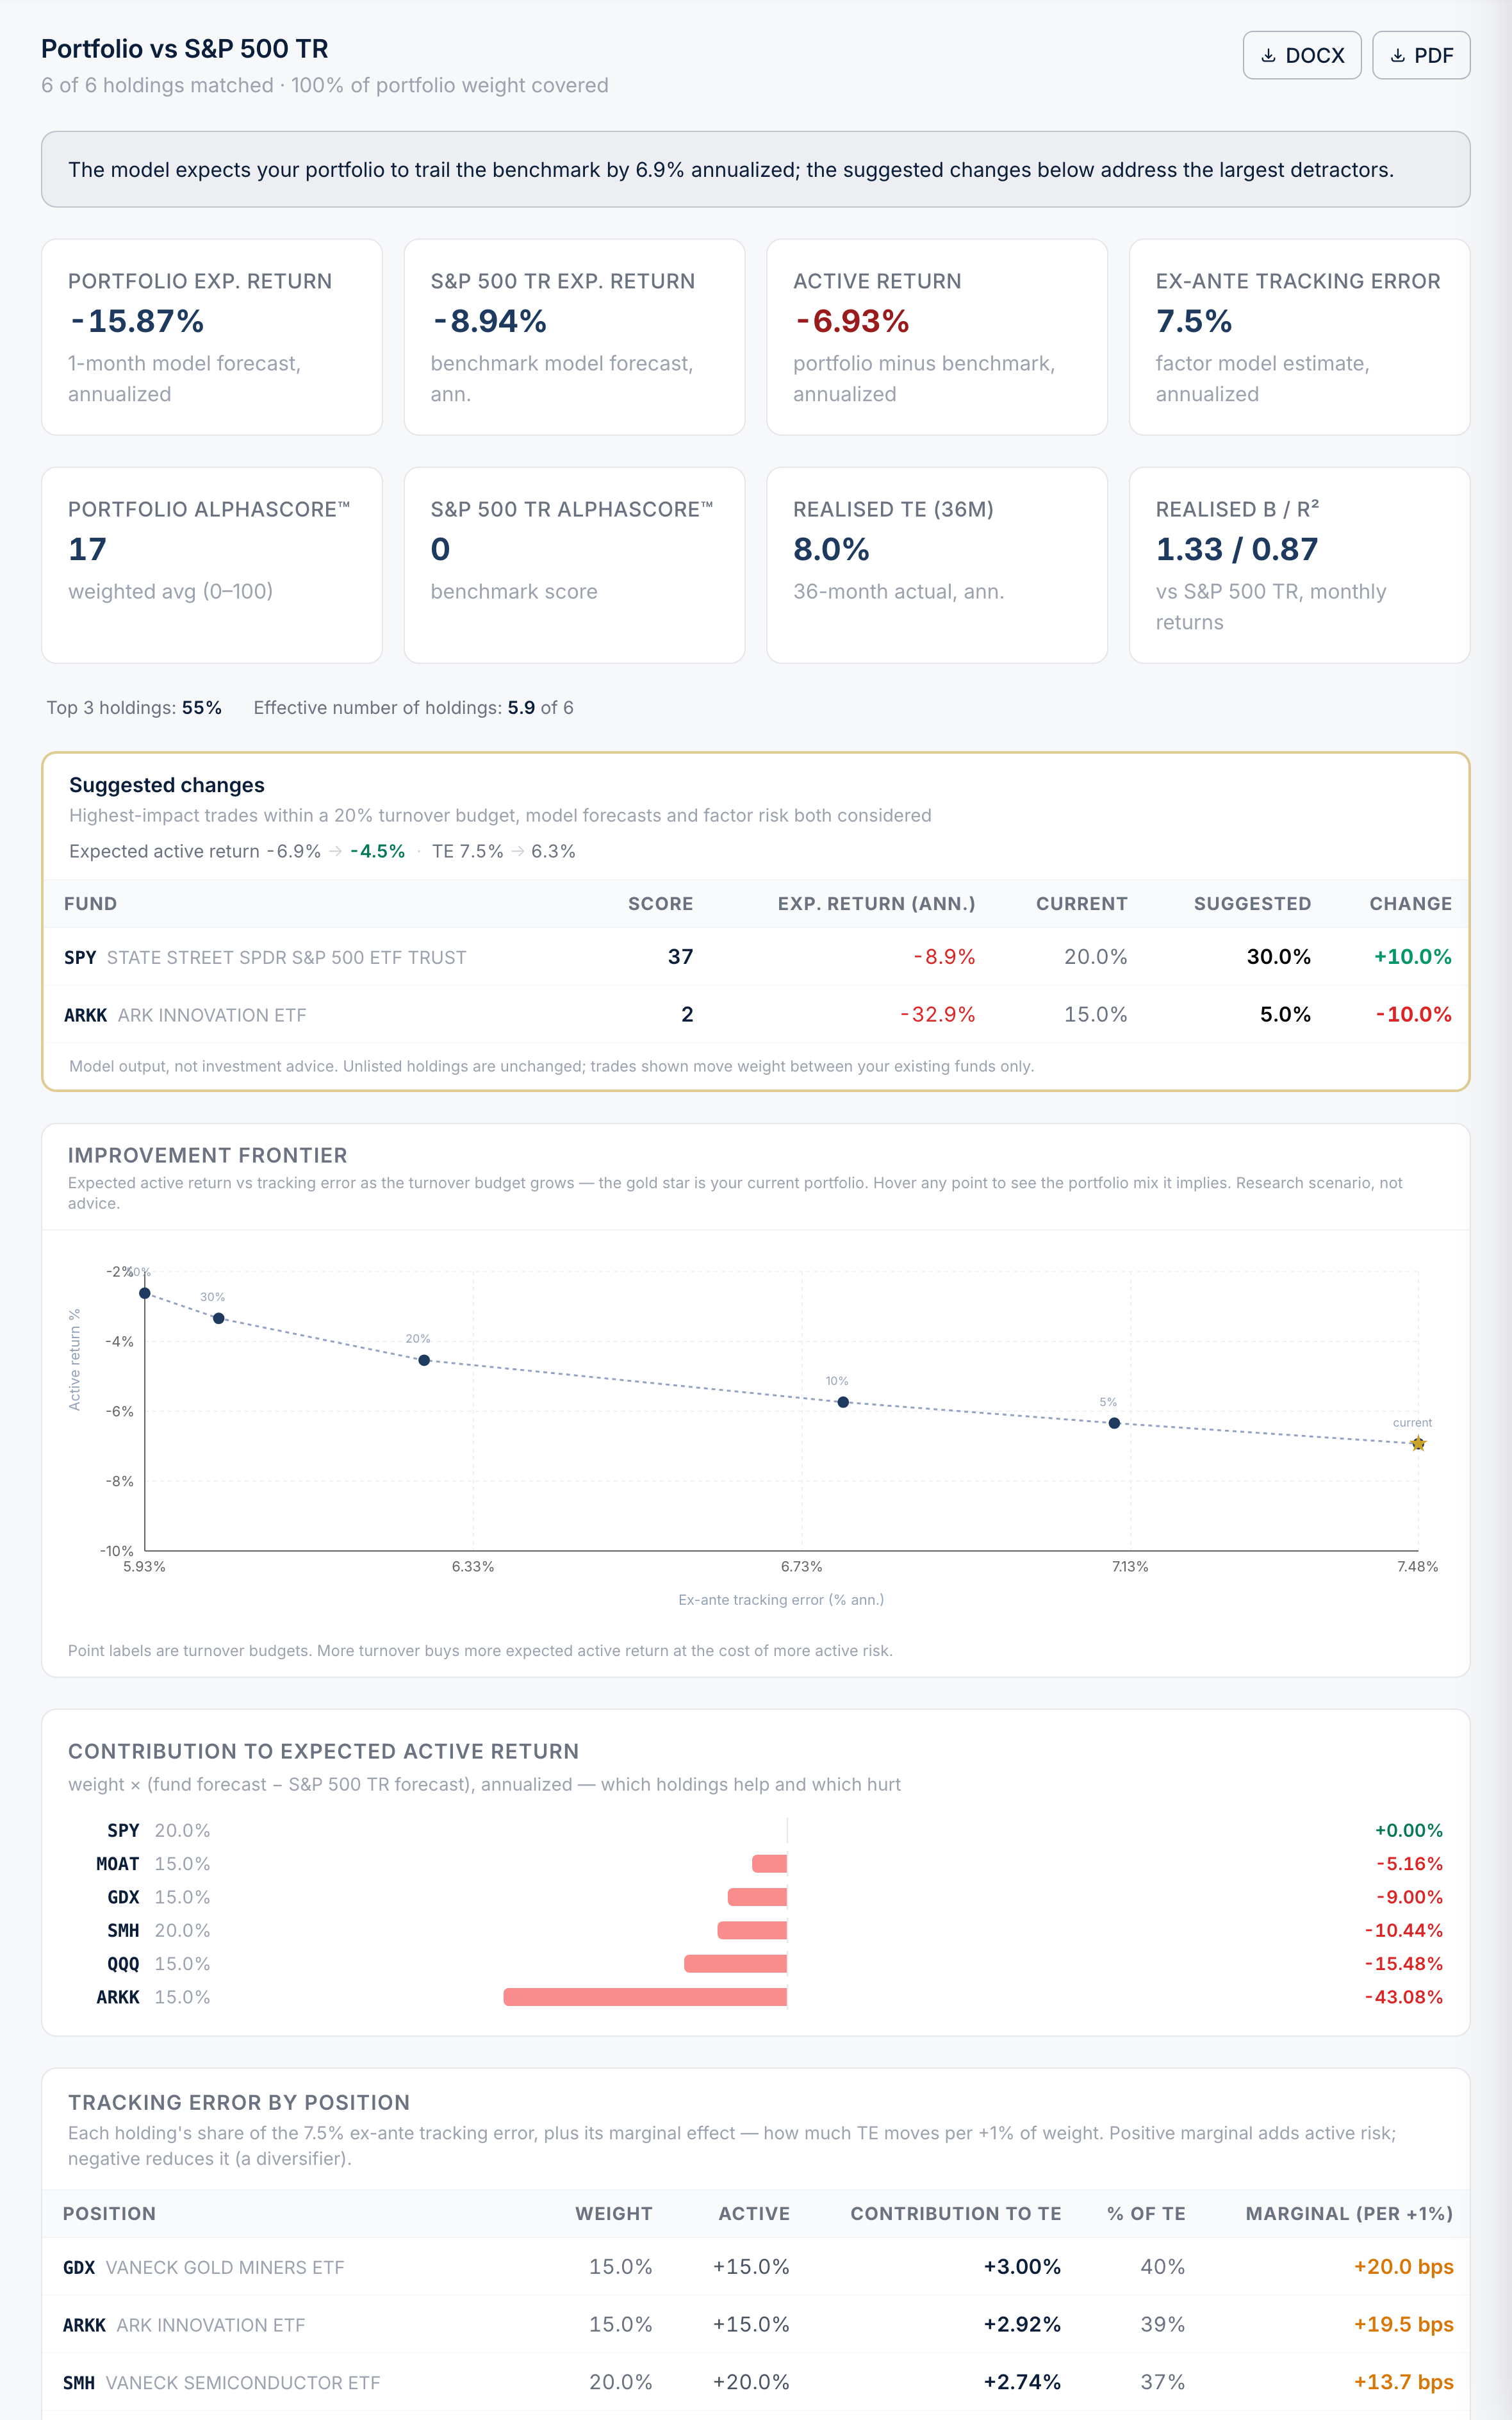
Paste any portfolio and measure it against a benchmark: expected active return, tracking error, and a per-holding breakdown of which positions drive your active risk — and which way each trade moves it. The optimizer proposes the highest-impact changes within a turnover budget.
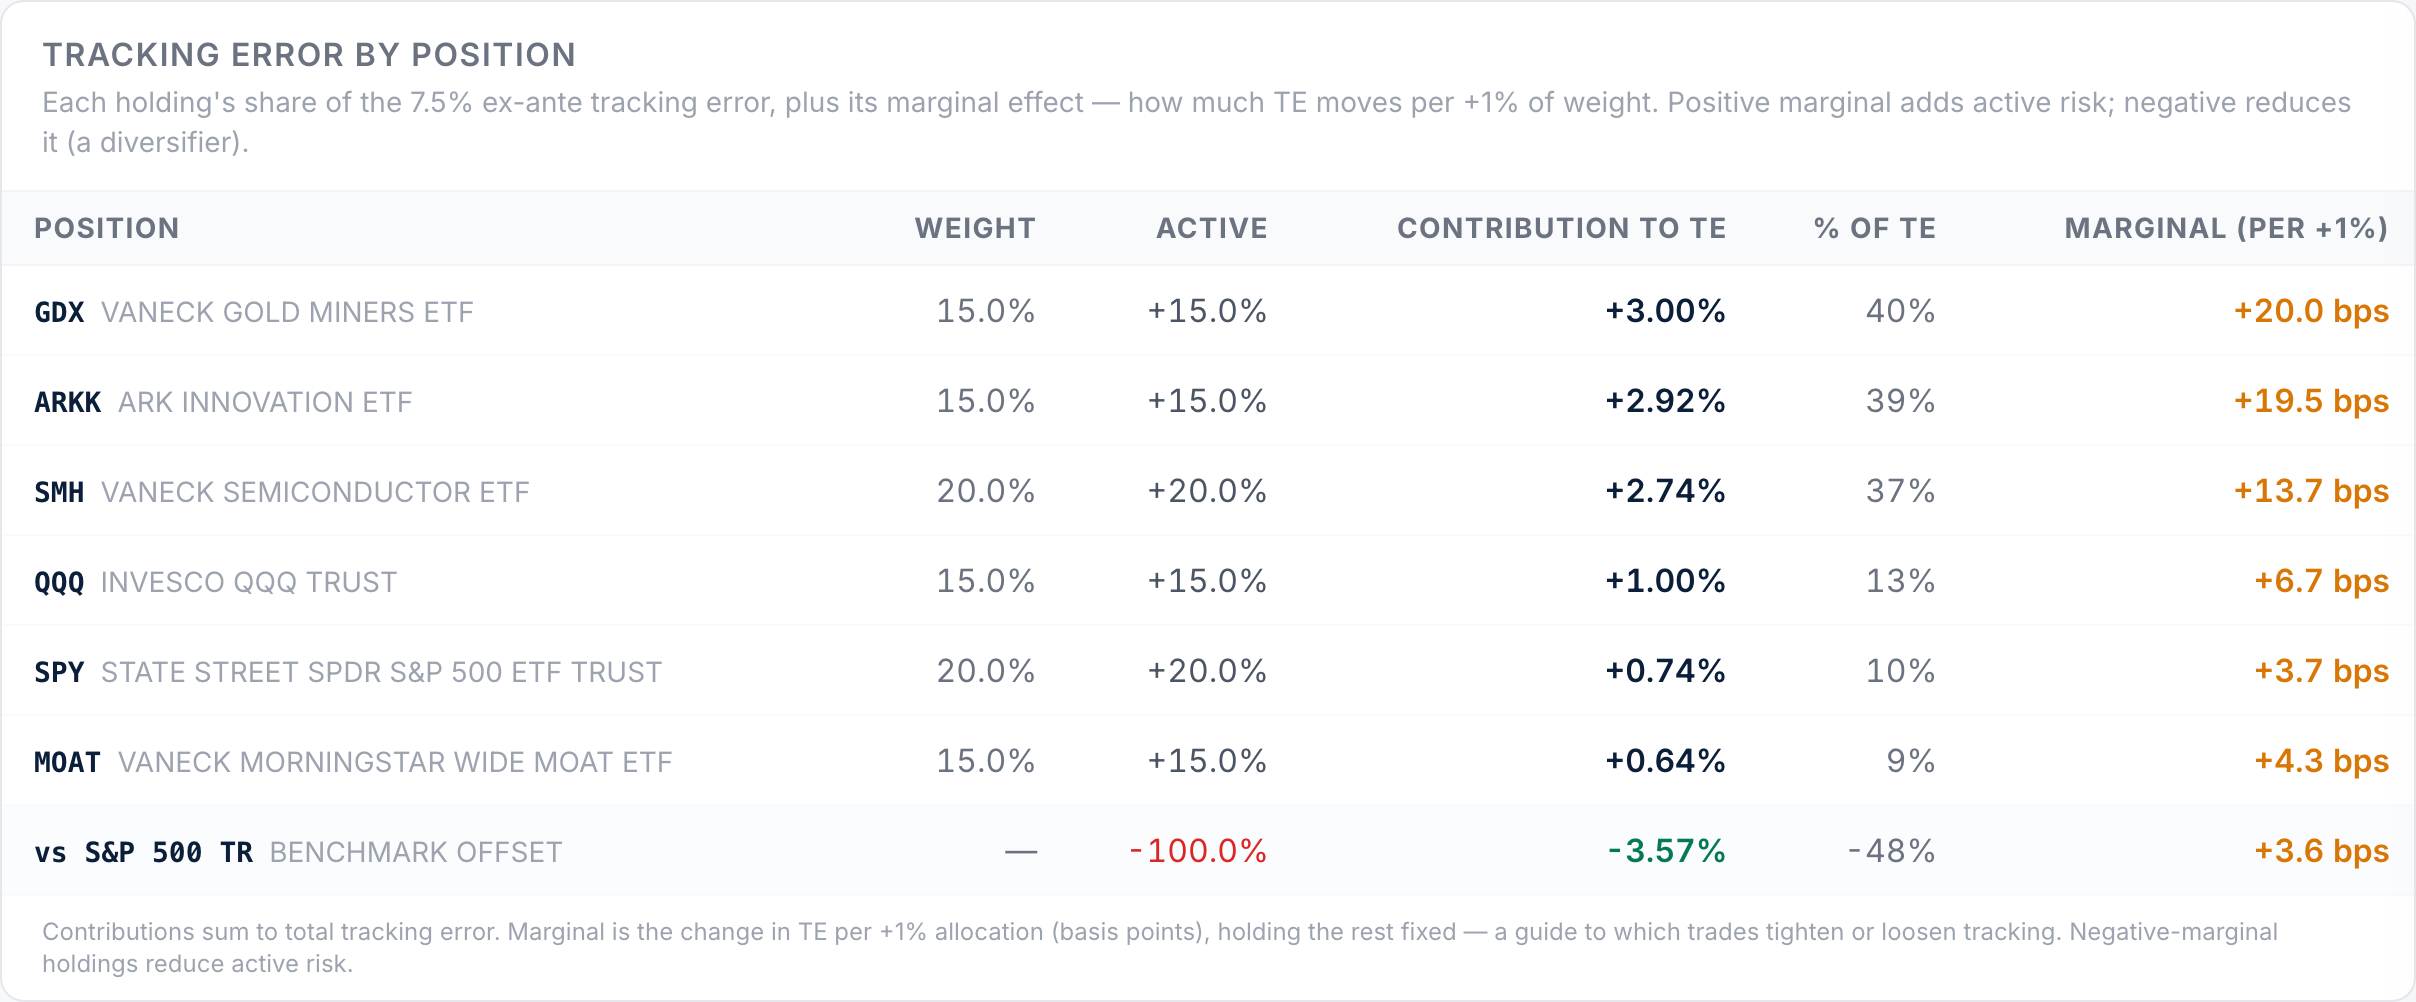
Tracking error by position
Per-holding tracking-error contribution for a portfolio of IWB, SCHD, VGT, XLE, VPU, VNQ and QQQ

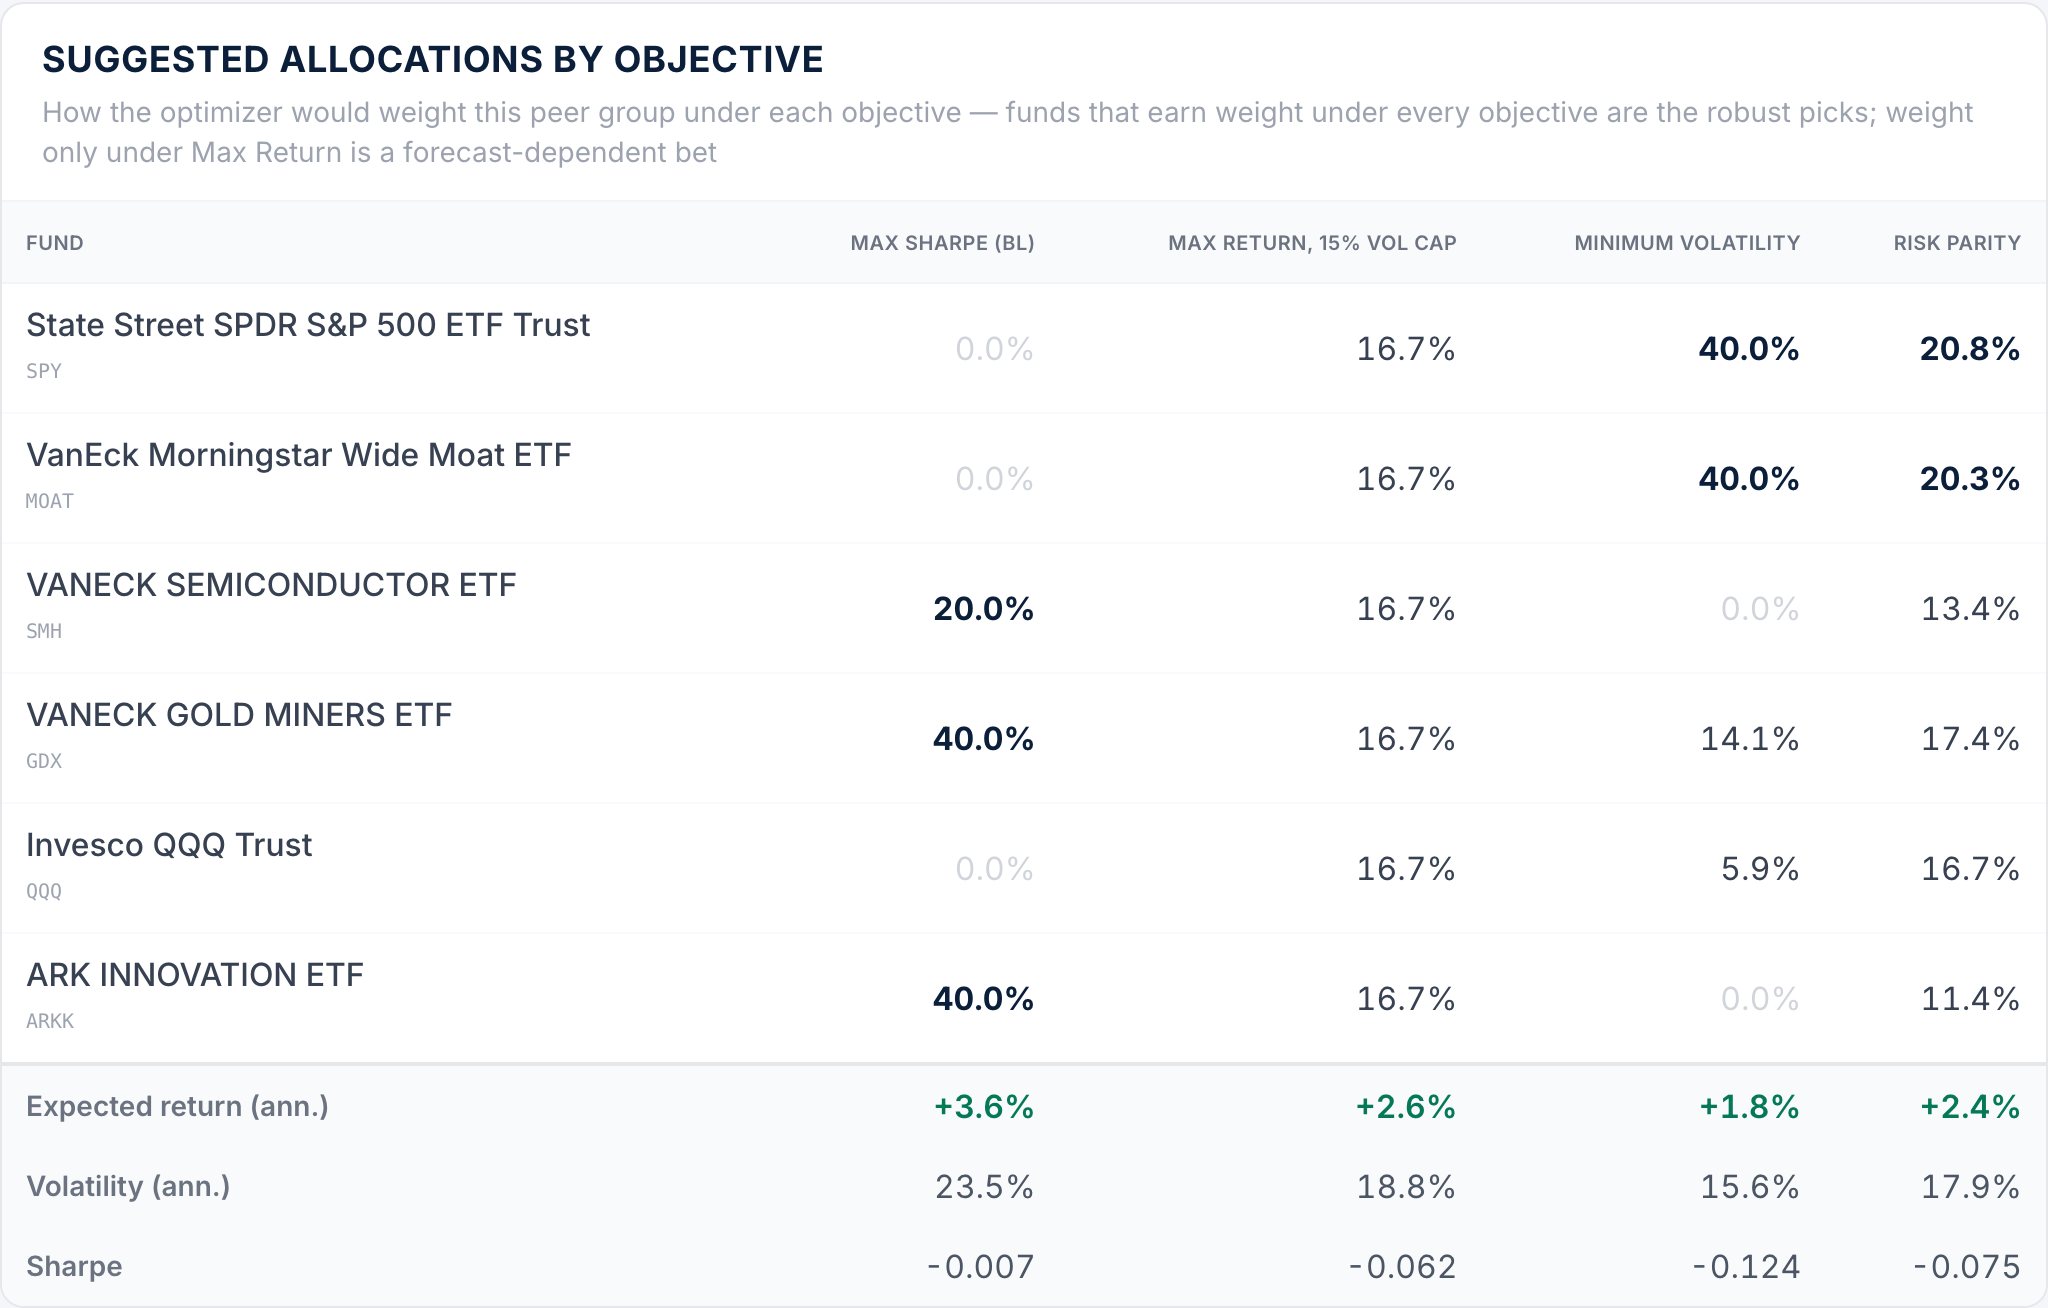
Portfolio construction

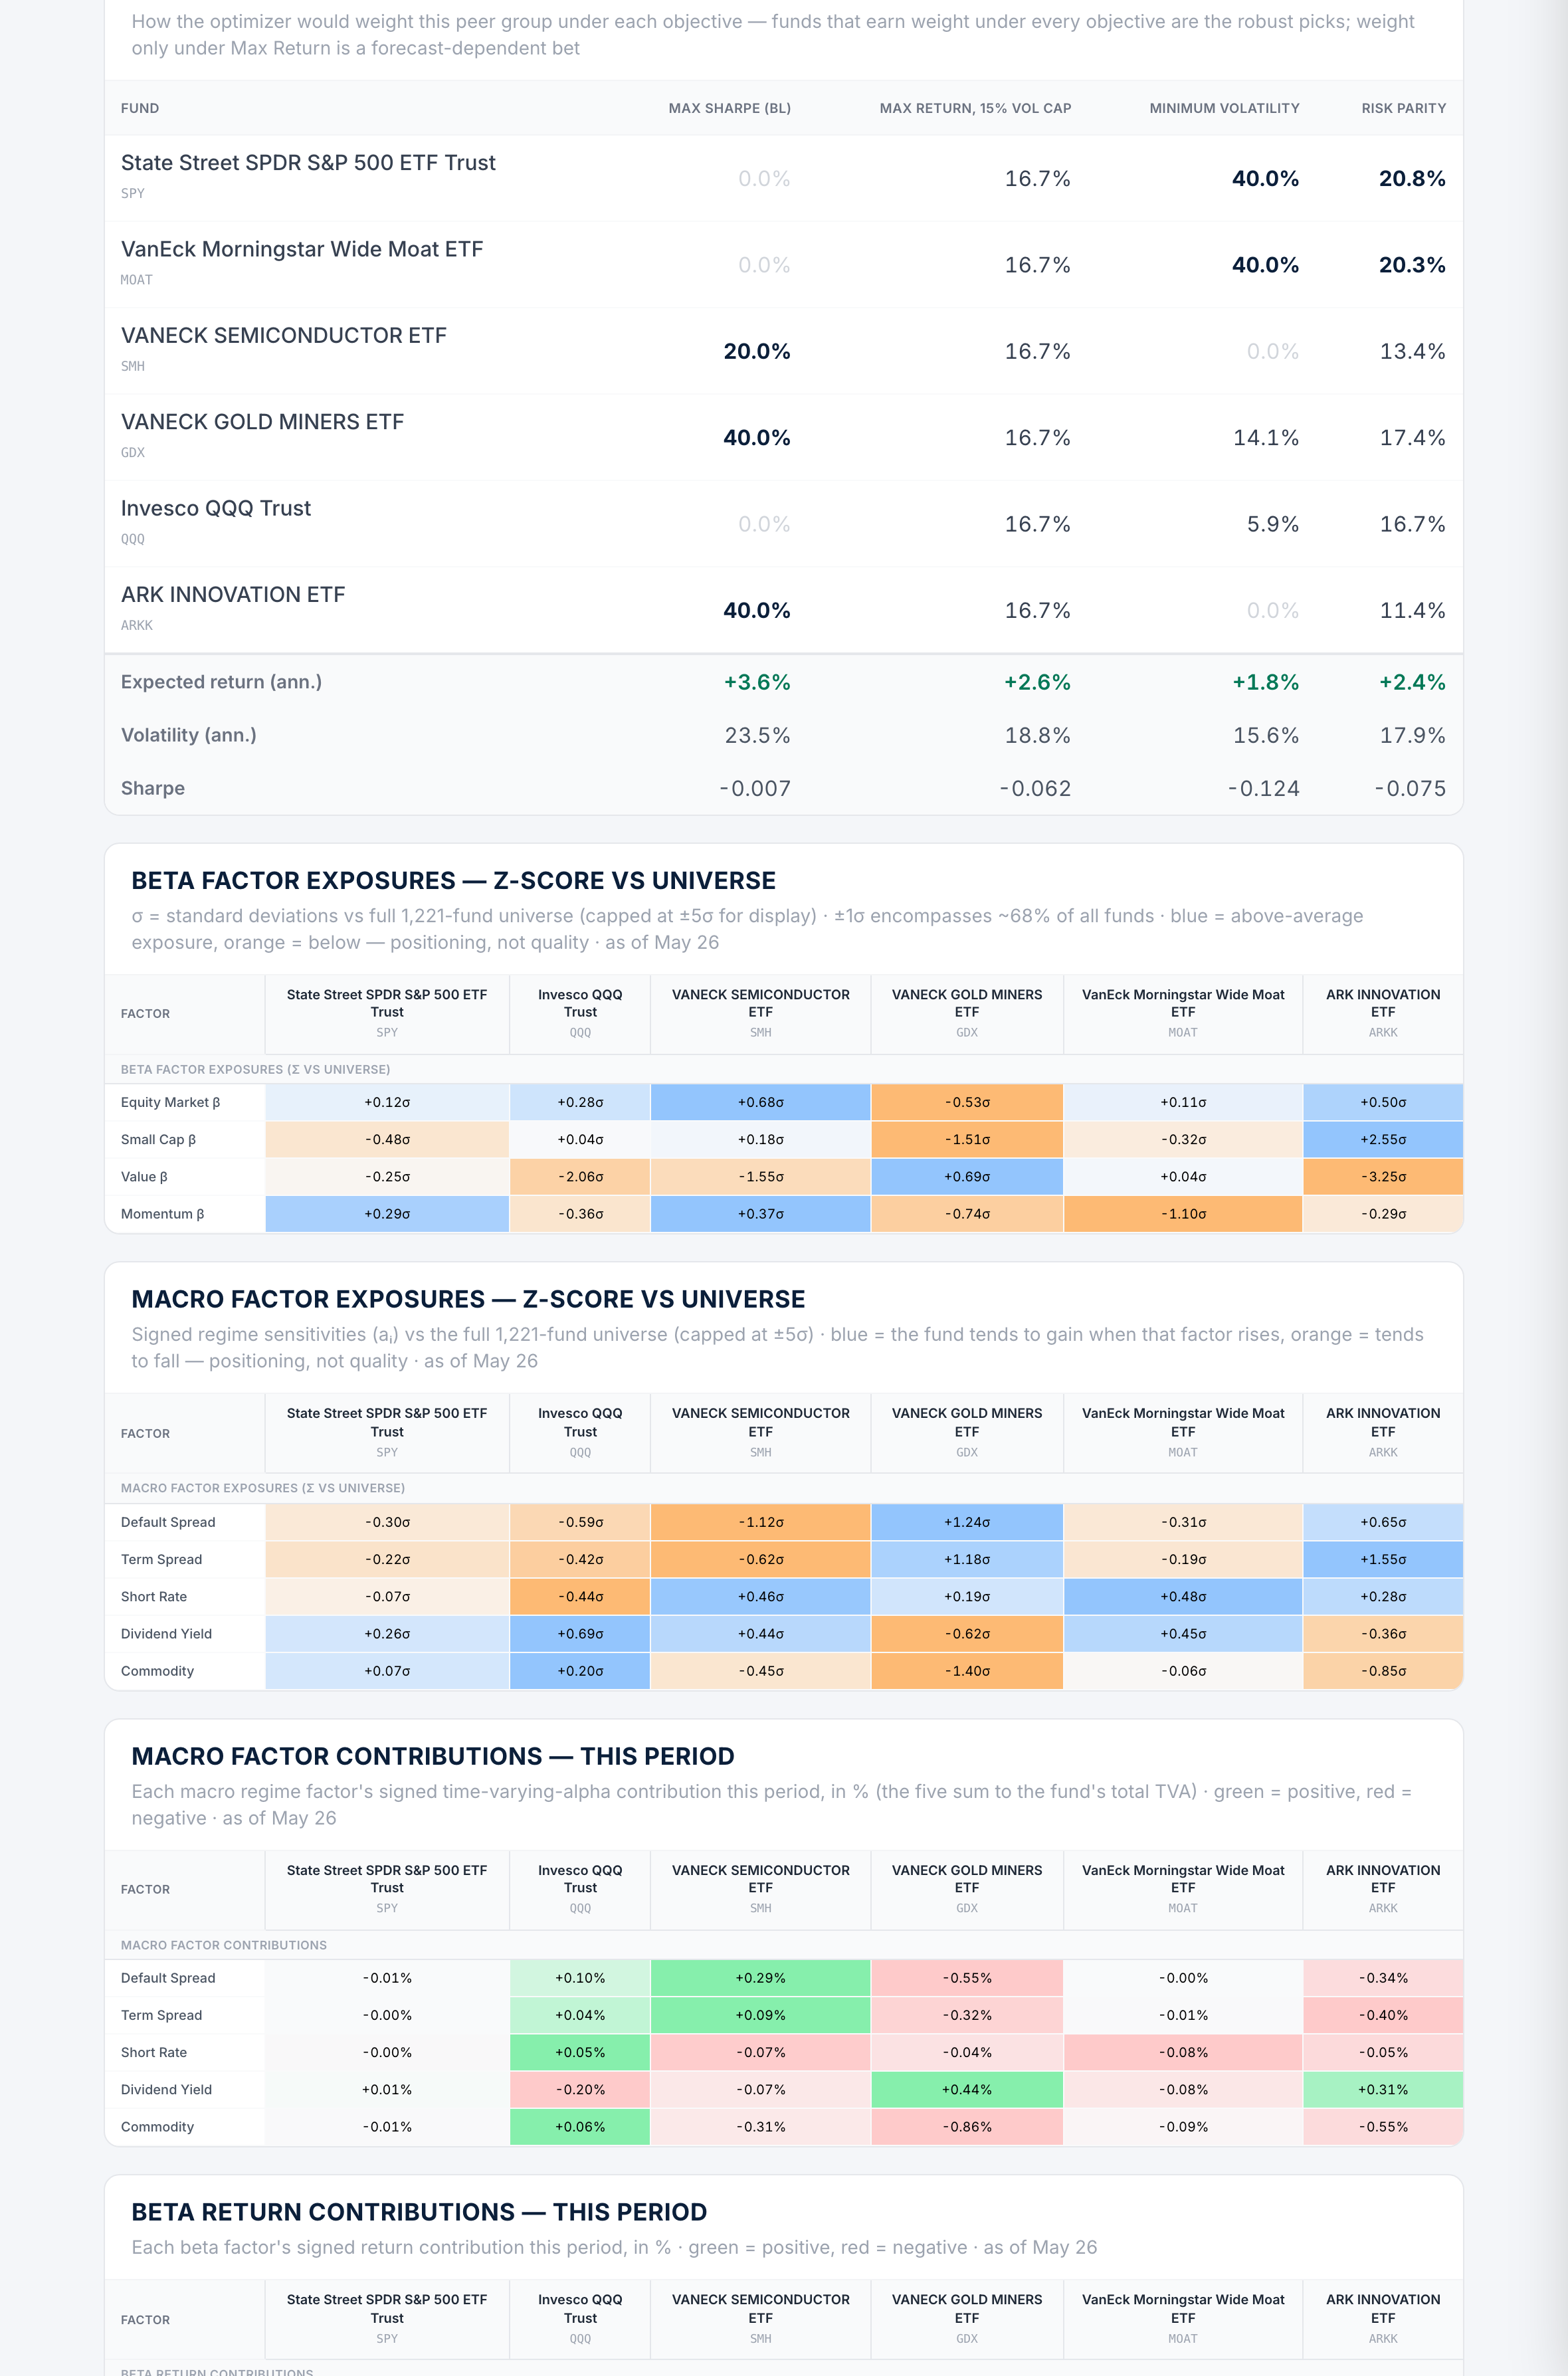
One peer group, four ways to weight it

The optimizer proposes allocations under four objectives at once — max Sharpe, max return within a volatility cap, minimum volatility, and risk parity — over a factor-aware covariance. Funds that earn weight under every objective are the more robust candidates; weight only under max-return signals a forecast-dependent position.

Suggested allocations by objective
Suggested allocations across max Sharpe, max return, minimum volatility and risk parity objectives

This month

When the model changes its mind, you see it

Each vintage, scores move because the model revised its beliefs — new returns and macro readings, not just price action. The biggest moves, funds entering and leaving the top decile, and category-level shifts, in one view. Star the funds you follow and track them month to month.

This Month
Biggest month-on-month AlphaScore gains

The engine

A model that learns every month

Rather than re-running a regression over a fixed window, AlphaPredictor® holds a belief about each fund and updates it as new data arrives — sharpening its forecasts and tracking its own confidence.

Prior belief

What the model already expects for a fund, informed by its own history and the wider universe of similar funds.

New data

Each month's returns and macro readings update that belief into a sharper posterior — and adjust how confident the model should be.

Forward view

The posterior becomes the next month's return signal — adapting to regime shifts instead of lagging a fixed lookback.

Who's behind it

Built by the people who wrote the research

AlphaPredictor® comes out of Parala Capital, a London quantitative research firm founded by finance professors and senior practitioners — the methodology behind it is published, peer-reviewed, and used in research advising institutional investors.

Top journals

Research published in the Journal of Finance, Review of Financial Studies and Journal of Financial Economics

Professors

Founding partners hold finance professorships at leading US universities, specializing in financial econometrics and asset allocation

Fed advisors

Service on the US Federal Reserve's Model Validation Council, plus an NYSE award for best paper on equity trading

$2.9B

Parala's research advises institutional investors on roughly $2.9 billion of assets

Meet the team at parala.com →

Built for

Professional fund selectors

Model portfolio providers & TAMPs

A forward-looking, documented basis for the ETF sleeve of every model — and a repeatable, defensible selection process advisors can stand behind.

  • Rank 1,221 ETFs on their return signal, not the trailing three years
  • Client-ready Insights reports with the model's reasoning
  • Benchmark and tracking-error analysis on any model

Asset managers & ETF issuers

See where your funds and your competitors' sit on the same forward-looking, factor- and macro-decomposed scale.

  • Decompose any equity ETF into alpha, beta and macro sensitivity
  • Position a product against its peer group at a glance
  • Factor-implied overlap and correlation across the line-up

Multi-asset & selection desks

Go past expense ratios and star ratings to the factor and macro drivers — over a model whose track record you can inspect yourself.

  • Optimize across five objectives on a factor-aware covariance
  • Max information ratio vs a benchmark within a TE budget
  • Inspect the live, out-of-sample validation in full

Client-ready outputs

A report your clients can actually read

Any fund or portfolio exports to a self-contained document — the signal, its decomposition, the factor and macro exposures, risk and suggested allocations, in plain language. Preview a sample:

See AlphaPredictor® on your universe

Request access for a walkthrough of the platform and the validation behind it.

Review the track record